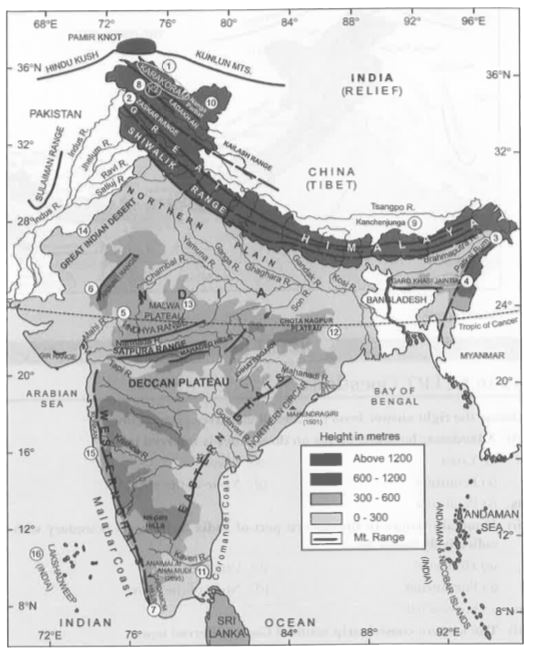
On the given outline map of India show the following:
(1) The Karakoram, (2) The Zaskar, (3) The Patkai Bum, (4) The Jaintia, (5) The Vindhya range, (6) The Aravalli, (7) The Cardamom hills, (8) K2, (9) Kanchenjunga, (10) Nanga Parbat (11) the Anai Mudi, (12) Chota Nagpur and (13) Malwa (14) The Indian Desert, (15) Western Ghats, (16) Lakshadweep Islands.
Topper's Solved these Questions
- PHYSICAL FEATURES OF INDIABOOK - VK GLOBAL PUBLICATIONCHAPTER - PHYSICAL FEATURES OF INDIAEXERCISE - NCERT Corner ( Answer to NCERT Questions )(Choose the right answer from the four alternatives )
4 Videos
- PHYSICAL FEATURES OF INDIABOOK - VK GLOBAL PUBLICATIONCHAPTER - PHYSICAL FEATURES OF INDIAEXERCISE - NCERT Corner ( Answer to NCERT Questions )(Answer the following questions briefly )
4 Videos
- PHYSICAL FEATURES OF INDIABOOK - VK GLOBAL PUBLICATIONCHAPTER - PHYSICAL FEATURES OF INDIAEXERCISE - HOTS ( Higher Order Thinking Skills )
9 Videos
- NATURAL VEGETATION AND WILDLIFE BOOK - VK GLOBAL PUBLICATIONCHAPTER - NATURAL VEGETATION AND WILDLIFE EXERCISE - NCERT Corner (Source-based Question)
3 Videos
- POPULATIONBOOK - VK GLOBAL PUBLICATIONCHAPTER - POPULATIONEXERCISE - NCERT CORNER (Answer to NCERT Questions)
11 Videos
Similar Questions
On the map of India, mark and locate the following 16−17th century cities of Southern India.
1. Bijapur 2. Warangal 3. Thanjavur 4. Quilon 5. Golconda 6. Kanchipuram 7. Vijayanagara 8. Bidar 9. Chandragiri 10. Madurai 11. Mysore 12. Kolar 13. Tirunelveli
View SolutionThe ages of 40 students are given in the following table: Age(in yrs) 12 13 14 15 16 17 18 Frequency 2 4 6 9 8 7 4 Find the arithmetic mean.
View Solution
Knowledge Check
Find the mode of the following discrete series.
x123456789f381519121457A7B5C2D3
Find the sum of deviations of the following data measured from their actual mean.
10.3, 12.5, 13.7, 9.4, 8.6, 11.2, 12.1, 10.9, 13.2, 15.4, 14.7, 9.1, 14.2, 15.8, 7.8.
View SolutionFind the standard deviation for the following data:
(i) x:3,8,13,18,23
f:,7,10,15,10,6
(ii) x:1,2,3,4,5,6,7
f:4,9,16,14,11,6,6
View SolutionFind the standard deviation for the following data: (i) x: , 3, 8, 13, 18, 23 f: , 7, 10, 15, 10, 6 (ii) x: , 2, 3, 4, 5, 6, 7, 7 f: , 4, 9, 16, 14, 11, 6, 6
View SolutionObtain the median for the following frequency distribution: x : 1 2 3 4 5 6 7 8 9 f : 8 10 11 16 20 25 15 9 6
View SolutionObtain the median for the following frequency distribution: x : 1 2 3 4 5 6 7 8 9 f : 8 10 11 16 20 25 15 9 6
View SolutionWhich of the two rational numbers is greater in each of the following pairs?
(i) 3−7 or 17, (ii) 11−18 or −518, (iii) 710 or −910
(iv) 0 or −34, (v) 112 or 0, (vi) 18−19 or 0
(vii) 78 or 1116, (viii) 11−12 or −1011, (ix) −135 or −4
(x) 17−6 or −134, (xi) 7−9 or −58, (xii) −3−8 or 59
View SolutionConvert each of the following Into an improper fraction:
(i) 557
(ii) 938
(iii) 6310
(iv) 3511
(v) 10914
(vi) 12715
(vii) 8813
(viii) 5123
View Solution

