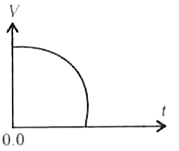
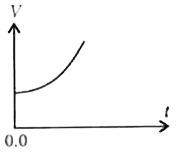
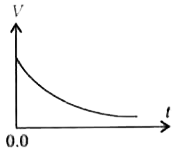
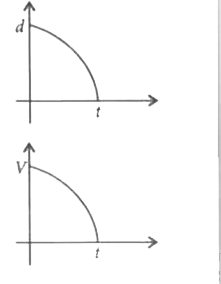
The insulated plates of a charged parallel plate capacitor (with small separation between the plates) are approaching each other due to electrostatic attraction . Assuming no other force to be operative and no radiation taking place , which of the following graphs approximately shows the variation with time (t) of the potential difference (V) between the plates ?
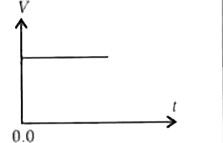
The correct Answer is:d
As separation between the plates are decreasing as they approach each other.
Also , electric field remains constant between the plates.
So , V∝dandV=E⋅d
Force on each plate =ma=q22Aε0
∴ Acceleration , a=q22Aε0m
since a = constant ∴ d-t graph will be so V - t curve (∵V∝d)
Topper's Solved these Questions
- ELECTROSTATICSBook:MTG-WBJEEChapter:ELECTROSTATICSExercise:(WB JEE Previous Years Questions ) CATEGORY 3 : One or More than One Opion correct Type
Explore 4 Videos
- ELECTROSTATICSBook:MTG-WBJEEChapter:ELECTROSTATICSExercise:(WB JEE Previous Years Questions ) CATEGORY 1 : Single Option correct Type
Explore 23 Videos
- ELECTROMAGNETIC WAVES Book:MTG-WBJEEChapter:ELECTROMAGNETIC WAVES Exercise:WB JEE WORKOUT (CATEGORY 3 : ONE OR MORE THAN ONE OPTION CORRECT TYPE)
Explore 10 Videos
- GRAVITATIONBook:MTG-WBJEEChapter:GRAVITATIONExercise:WB JEE Previous Years Questions (CATEGORY 1: Single Option Correct Type
Explore 7 Videos
Similar Questions
Knowledge Check
The separation between the plates of a charged parallel-plate capacitor is increased. The force between the plates
AincreasesBdecreasesCremains sameDfirst increases then decreasesForce of attraction between the plates of a parallel plate capacitor is
Aq22ε0AKBq2ε0AKCq2ε0ADq22ε0A2KA parallel plate capacitor is charged from a cell and then isolated from it. The separation between the plates is now increased
Awill decreaseBwill increaseCwill increase or decrease depending on chargeDwill remains same
A parallel plate capacitor having plate area A and separation between the plates d is charged to potential V.The energy stored in capacitor is ....???
View SolutionThe plates of a charged parallel plate capacitor attract each other by a force F= ____________, where q = charge on each plate and A = area of each plates.
View SolutionIn a parallel plate capacitor with plate area A and charge Q, the force on one plate because of the charge on the other is equal to
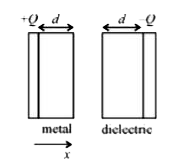
View SolutionPlates of a parallel plate capacitor are at a separation 3d. Region between the plates is filled with a metal plate and a dielectric each of thickness d as shown. Which of the following graphs correctly represent variation of potential V with x?
View SolutionIn a parallel plate capacitor with plate area A and charge Q, the force on one plate because of the charge on the other is equal to
View Solution
