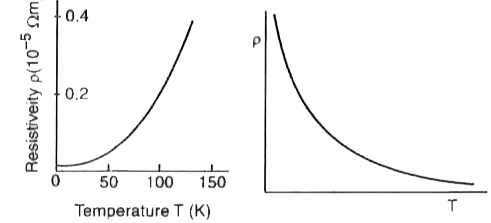
Draw a plot showing the variation of resistivity of a (i) conductor and (ii) semiconductor, with the increse in temperature. Solution in Kannada
Topper's Solved these Questions
- CURRENT ELECTRICITY BOOK - OSWAAL PUBLICATIONCHAPTER - CURRENT ELECTRICITY EXERCISE - TOPIC-1 ( ELECTRIC CURRENT, RESISTANCE & CALLS) (SHORY ANSWER TYPE QUESTIONS-II)
4 Videos
- CURRENT ELECTRICITY BOOK - OSWAAL PUBLICATIONCHAPTER - CURRENT ELECTRICITY EXERCISE - TOPIC-1 ( ELECTRIC CURRENT, RESISTANCE & CALLS) (LONG ANSWER TYPE QUESTIONS)
5 Videos
- CURRENT ELECTRICITY BOOK - OSWAAL PUBLICATIONCHAPTER - CURRENT ELECTRICITY EXERCISE - TOPIC-3 (POTENTIOMETER & APPLICATIONS) (NUMERICAL PROBLEMS)
2 Videos
- COMMUNICATION SYSTEMBOOK - OSWAAL PUBLICATIONCHAPTER - COMMUNICATION SYSTEMEXERCISE - TOPIC-3 INTERNET, MOBILE AND GPS (SHORT ANSWER TYPE QUESTIONS -I)
2 Videos
- DUAL NATURE OF RADIATION AND MATTERBOOK - OSWAAL PUBLICATIONCHAPTER - DUAL NATURE OF RADIATION AND MATTEREXERCISE - TOPIC-2 DE-BROGLIE RELATION (NUMERICAL PROBLEMS)
7 Videos
Similar Questions
State and explain ohm's law
View SolutionObtain an expression for the equivalent emf and internal resistance of two cells connected in parallel.
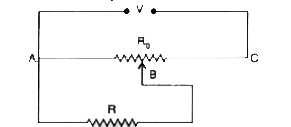
View SolutionA resistance of RΩ draws current from a potentiometer. The potentiometer has a total resistance R0Ω.A voltage V is supplied to the potentiometer. Derive an expression for the voltage across R when the sliding contact is in the middle of the potentiometer.

View SolutionArrange the following networks in increasing order of the number of computers that may be present in the network:
Internet, LAN, WAN
View SolutionCalculate de-Broglie wavelength associated with a rifle bullet of mass 2 gram moving with a speed of 400ms−1.
View SolutionShow on a graph, the variation of resistivity with temperature for a typical semiconductor.
View SolutionShow on graph, the variation of resistivity with temperature for a typical semiconductor. What is the order of resistivity of an conductor, semiconductor, Insulator ?
View SolutionShow variation of resistivity of (i) conductor (i.e. copper) (ii) semiconductor (sI) with temperature is a graph. Give reason.
View SolutionExplain the variation of resistivity of conductor and semiconductor with change in termperature.
View SolutionDefine the terms resistivity and conductivity and state their S. I. units. Draw a graph showing the variation of resistivity with temperature for a typical semiconductor.
View SolutionShow on a graph the variation of resistivity with temperature for a typical semiconductor
View SolutionShow, on a plot, variation of resistivity of (i) a conductor, and (i) a typical semiconductor as a function of temperature.
Using the expression for the resistivity in terms of number density and relaxation time between the collisions, explain how resistivity in thc casce of a conductor increases while it decrcases in a semiconductor, with the rise of temperature.
View SolutionShow on a graph, the variation of resistivity with temperature for a typical semiconductor.
View SolutionDraw the graph showing the variation of resistivity with temperature for silicon.
View SolutionExplain the variation of resistance of a semiconductor with temperature Also draw the graph showing the variation of resistivity of silicon with temperature
View Solution

