Show on a graph, the variation of resistivity with temperature for a typical semiconductor.
To show the variation of resistivity with temperature for a typical semiconductor, we can follow these steps:
Step 1: Understand the relationship between resistivity and temperature
- The resistivity (ρ) of a semiconductor decreases as the temperature increases. This is due to the increase in the number of charge carriers (electrons and holes) available for conduction as temperature rises.
Step 2: Recall the formula for resistivity
- The resistivity of a semiconductor can be expressed as:
ρ=mne2τ
where:
- m = mass of the charge carriers
- n = density of charge carriers (electrons and holes)
- e = charge of the carriers
- τ = relaxation time
Step 3: Analyze how temperature affects charge carrier density
- As temperature increases, the number of charge carriers (n) increases. Since resistivity is inversely proportional to the charge carrier density, an increase in n leads to a decrease in ρ.
Step 4: Draw the graph
- On the graph:
- The x-axis represents temperature (T).
- The y-axis represents resistivity (ρ).
- The graph will show a downward trend, indicating that as temperature increases, resistivity decreases.
Step 5: Label the graph
- Clearly label the axes and indicate that the curve represents the relationship between resistivity and temperature for a typical semiconductor.
Final Graph
- The graph will typically look like a downward sloping curve starting from a higher resistivity at lower temperatures and approaching lower resistivity values as the temperature increases.
- The resistivity (ρ) of a semiconductor decreases as the temperature increases. This is due to the increase in the number of charge carriers (electrons and holes) available for conduction as temperature rises.
- The resistivity of a semiconductor can be expressed as:
ρ=mne2τ
where:
- m = mass of the charge carriers
- n = density of charge carriers (electrons and holes)
- e = charge of the carriers
- τ = relaxation time
- As temperature increases, the number of charge carriers (n) increases. Since resistivity is inversely proportional to the charge carrier density, an increase in n leads to a decrease in ρ.
- On the graph:
- The x-axis represents temperature (T).
- The y-axis represents resistivity (ρ).
- The graph will show a downward trend, indicating that as temperature increases, resistivity decreases.
- Clearly label the axes and indicate that the curve represents the relationship between resistivity and temperature for a typical semiconductor.
- The graph will typically look like a downward sloping curve starting from a higher resistivity at lower temperatures and approaching lower resistivity values as the temperature increases.
Similar Questions
Define resistivity of a conductor. Plot a graph showing the variation of resistivity with temperature for a metallic conductor. How does one explain such a behaviour, using the mathematical expression of the resistivity of a material
View SolutionDraw a graph showing variation of resistivity with temperature for nichrome. Which property of nichrome is used to make standard resistance coils?
View Solution
Knowledge Check
Figure (a) and figure (b) both are showing the variation of resistivity (p) with temperature (T) for some materials. Identify the types of these materials.
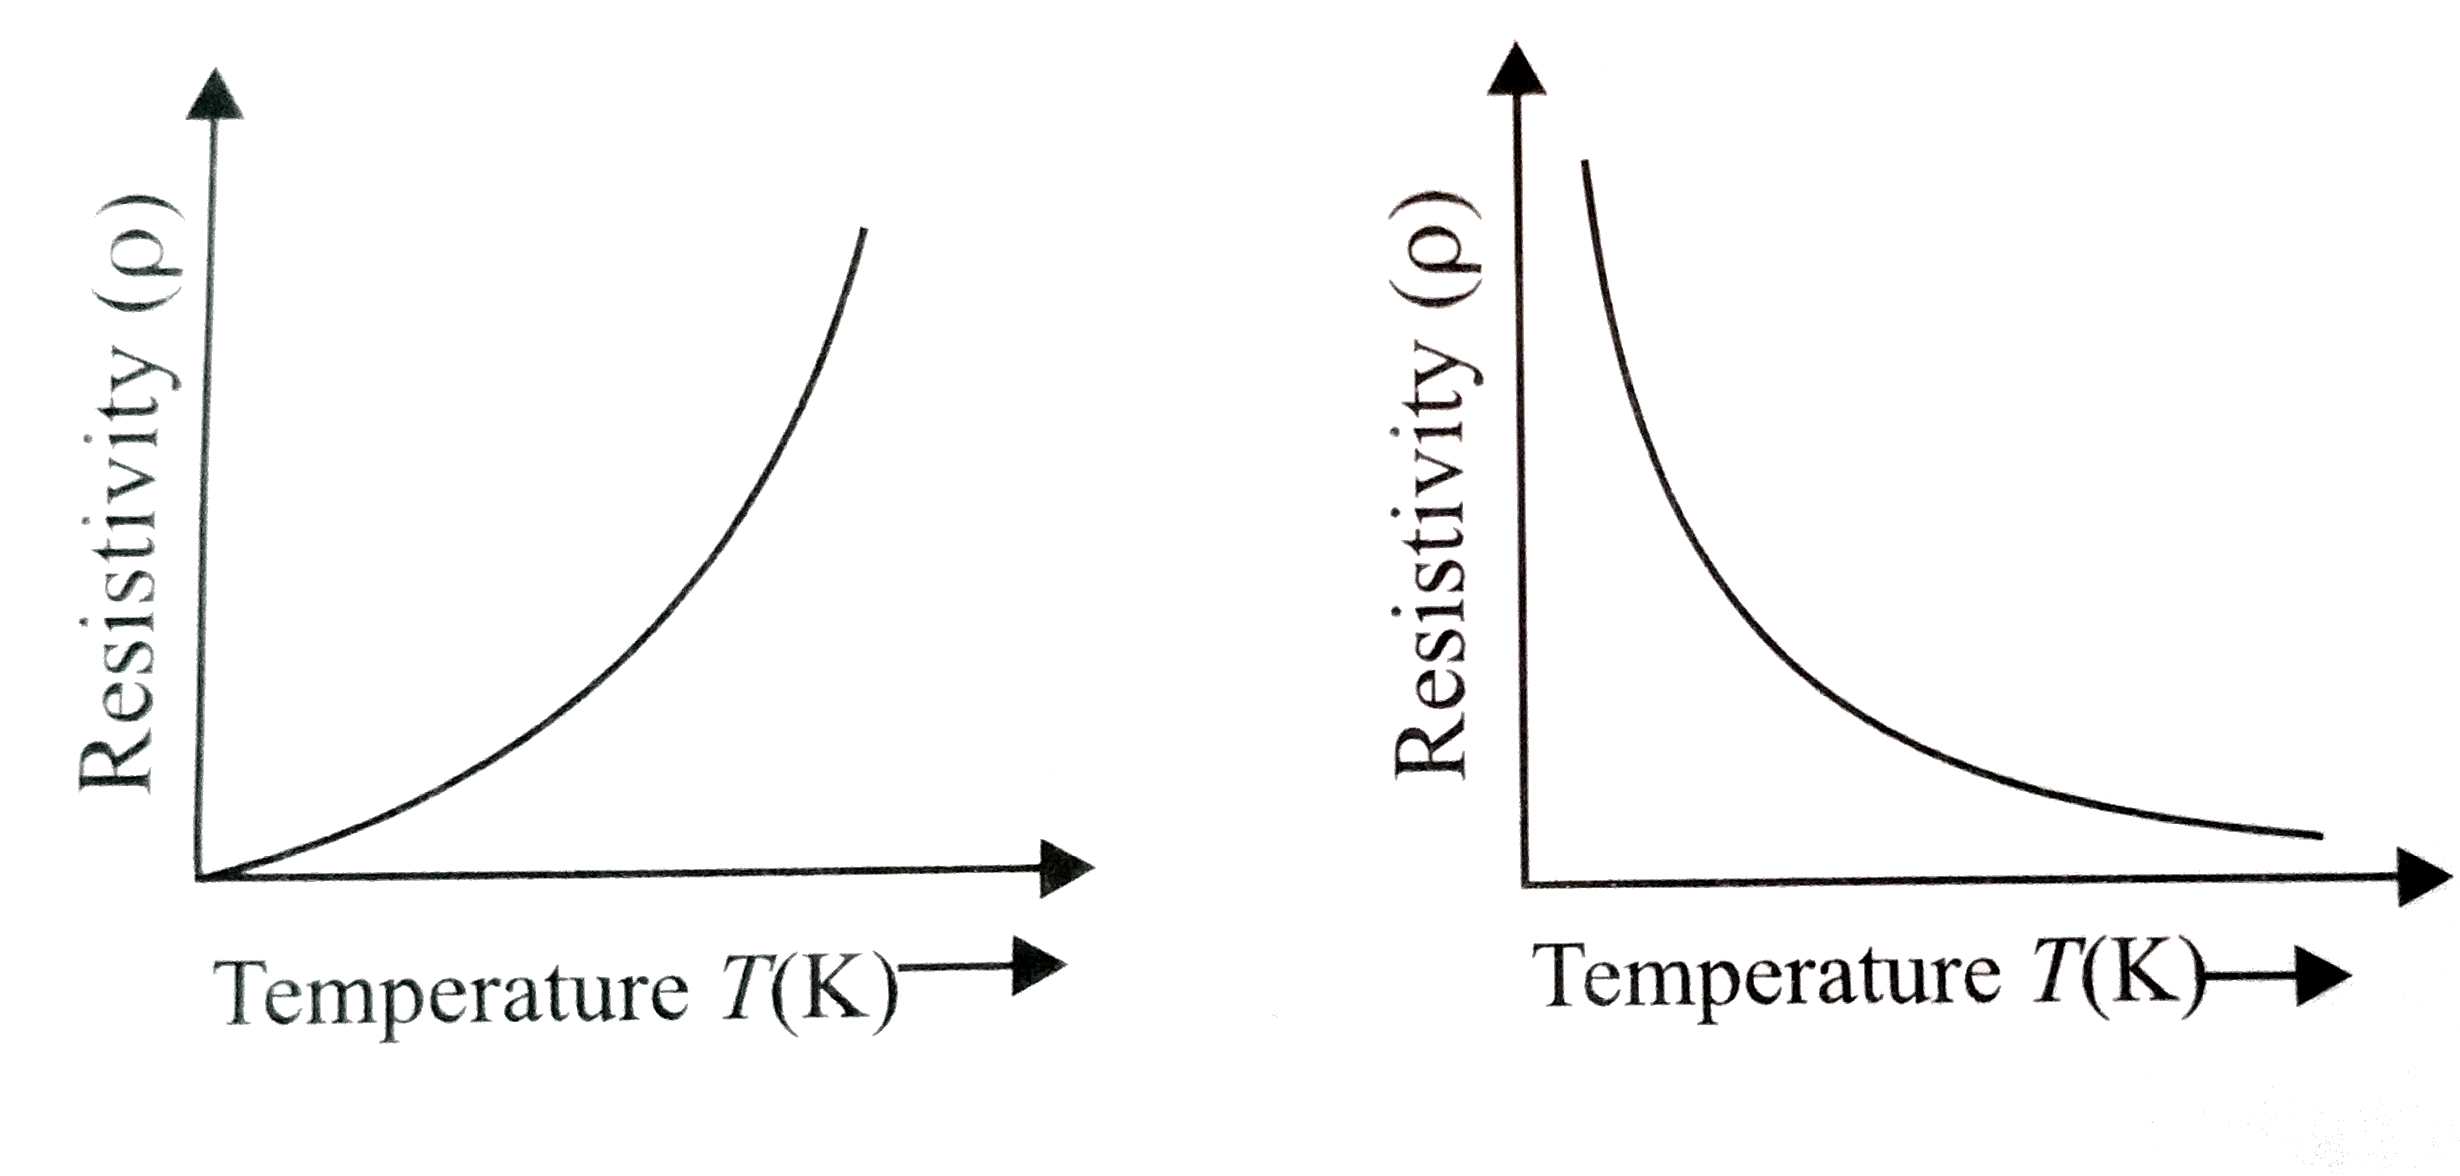 AConductor and semiconductorBConductor and InsulatorCInsulator and semiconductorDBoth are conductor
Which graph represents the variation of surface tension with temperature over small temperature ranges for water?
A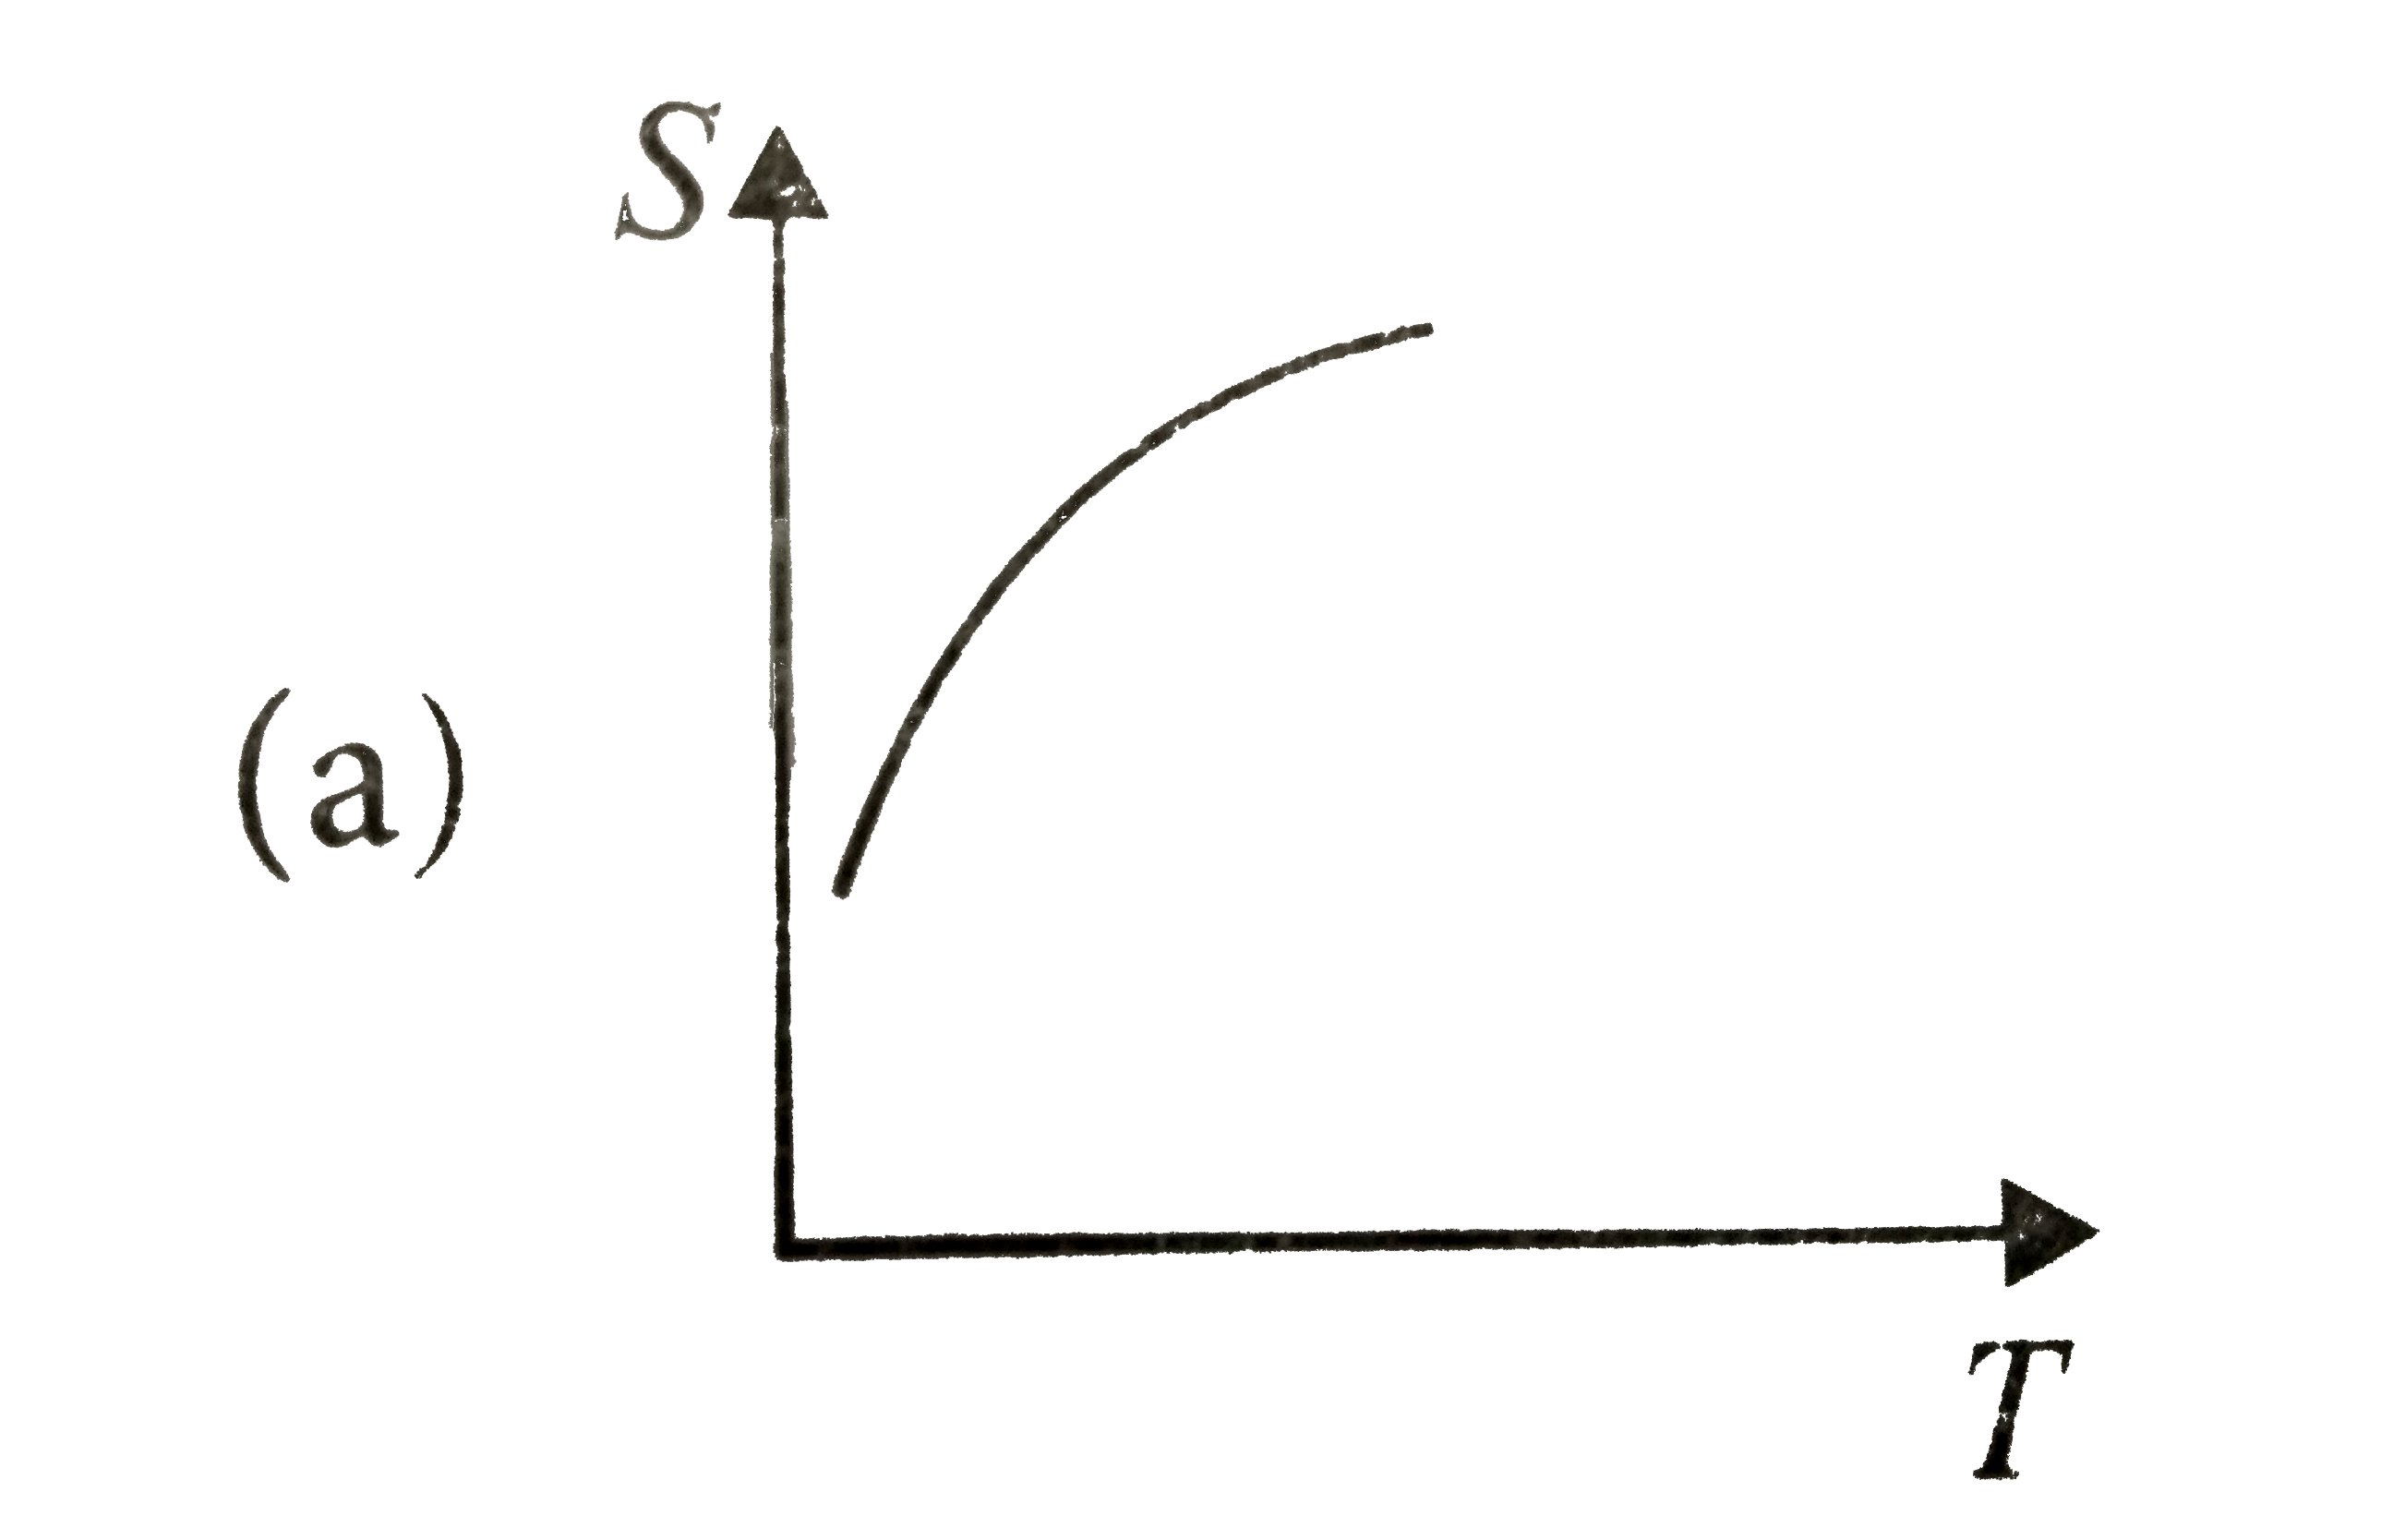 B
B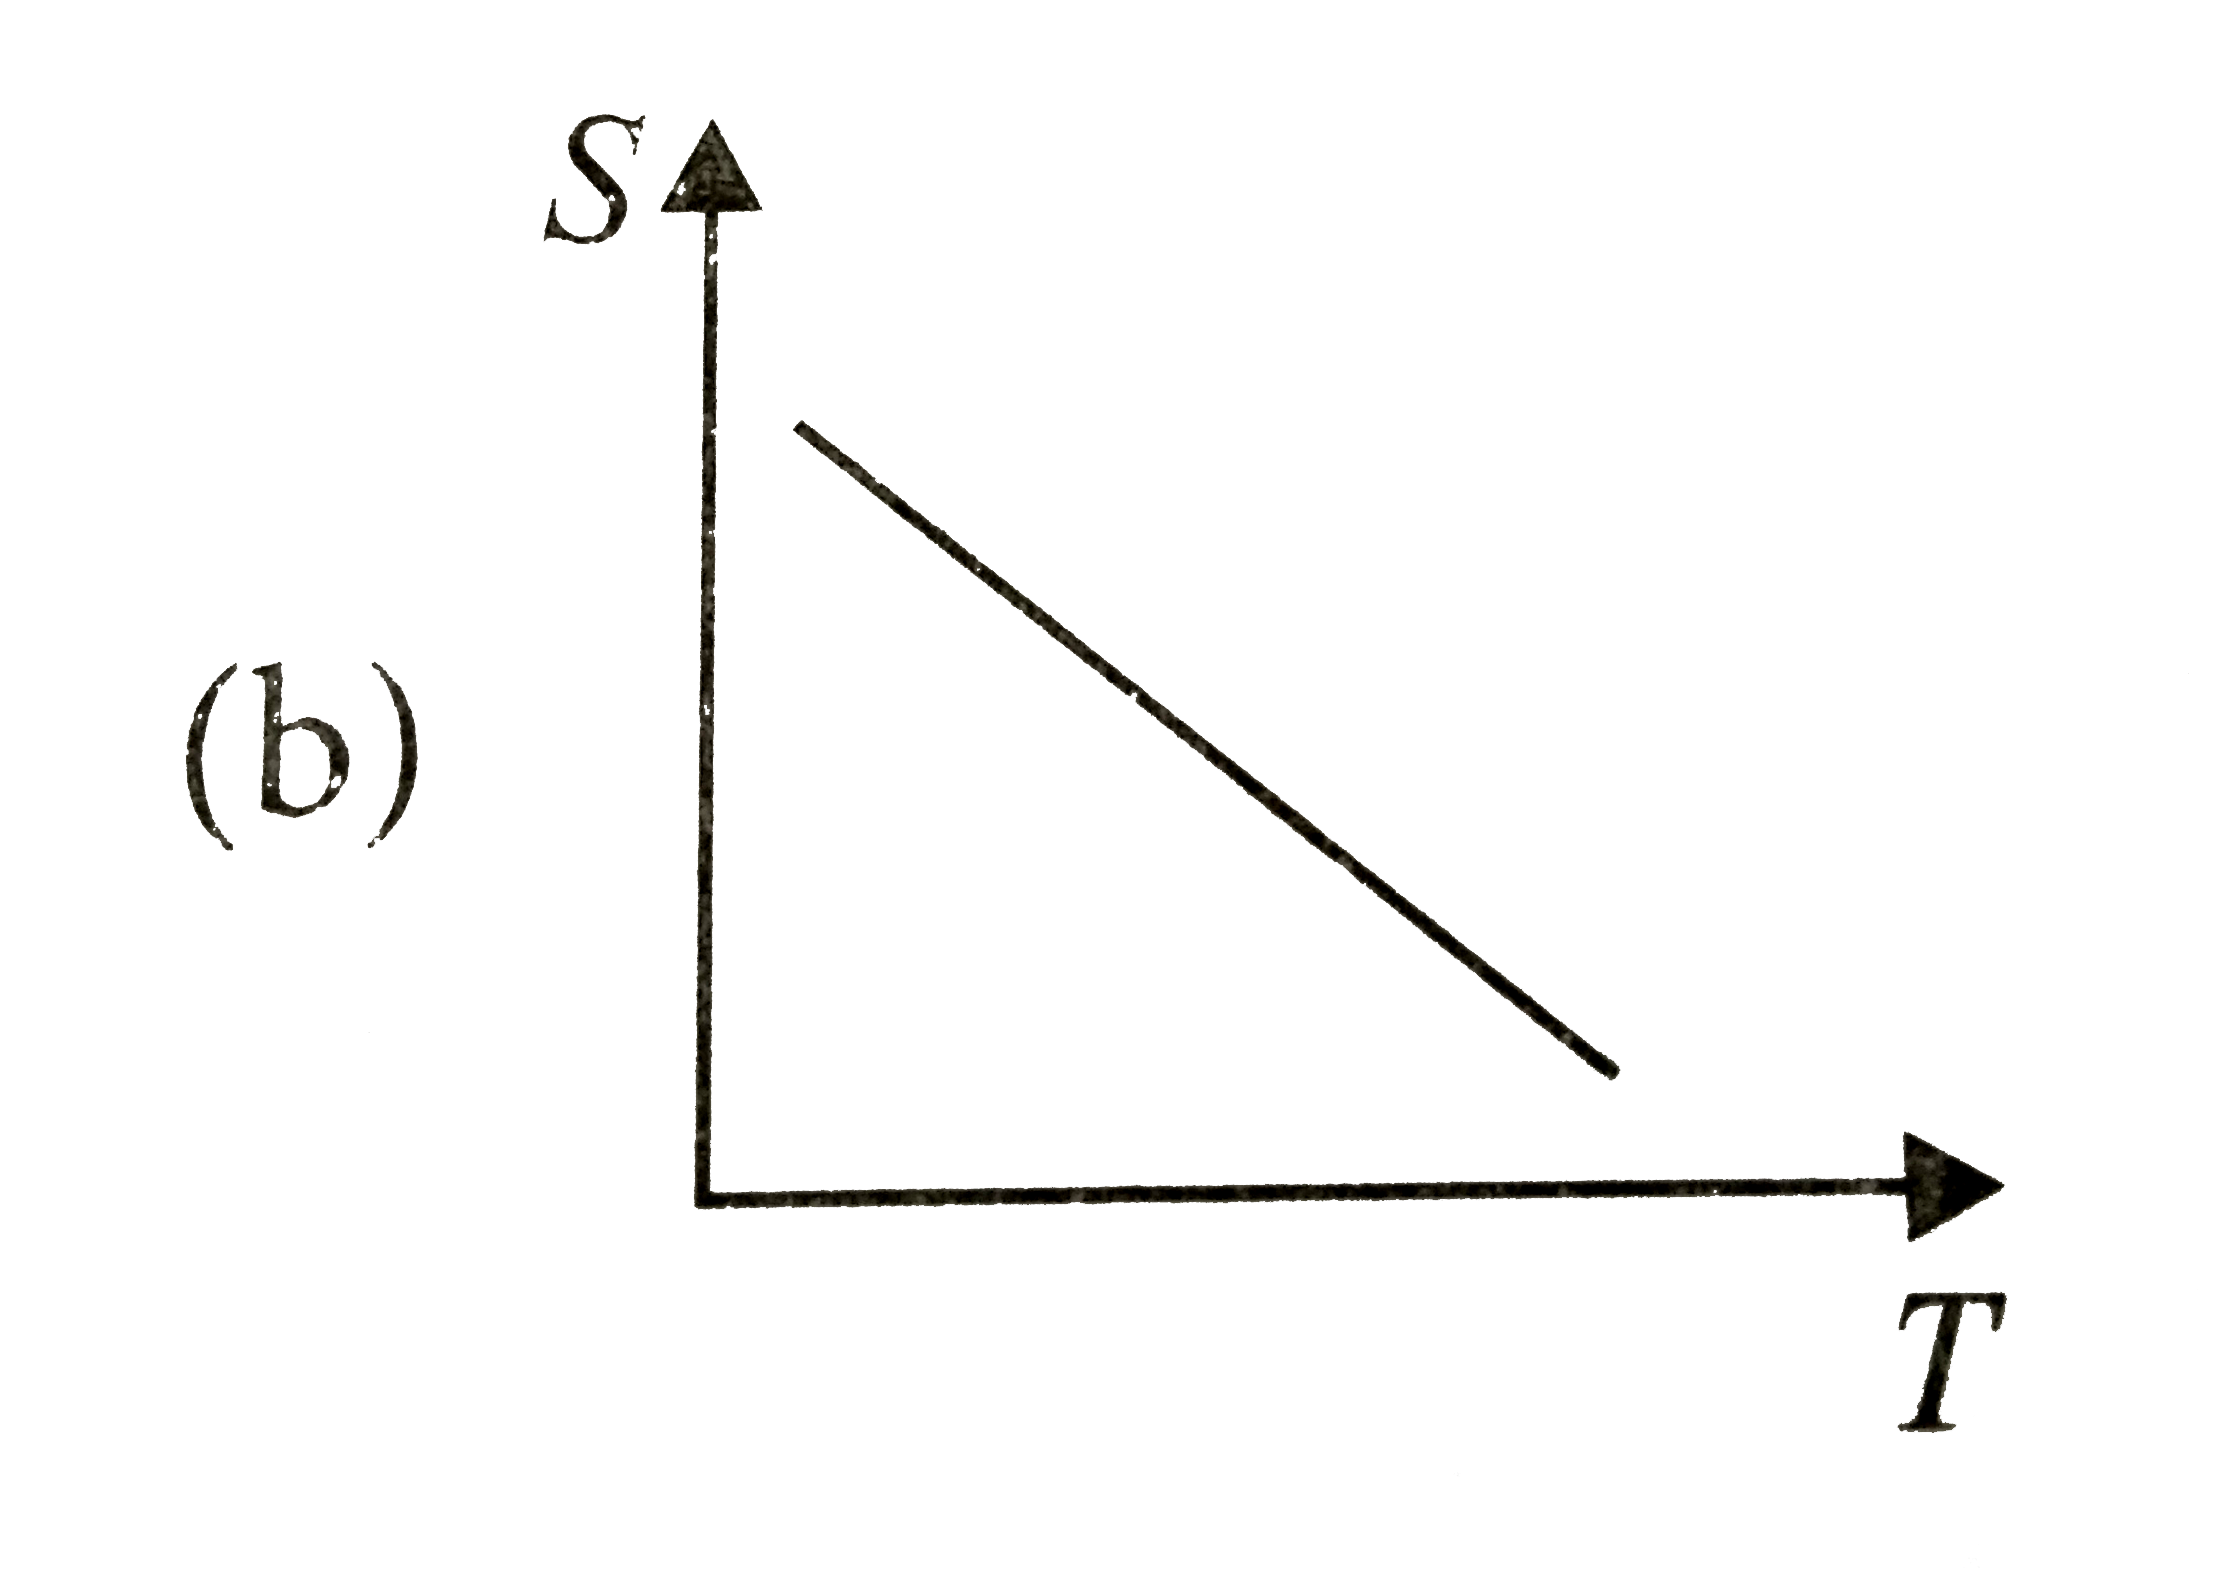 C
C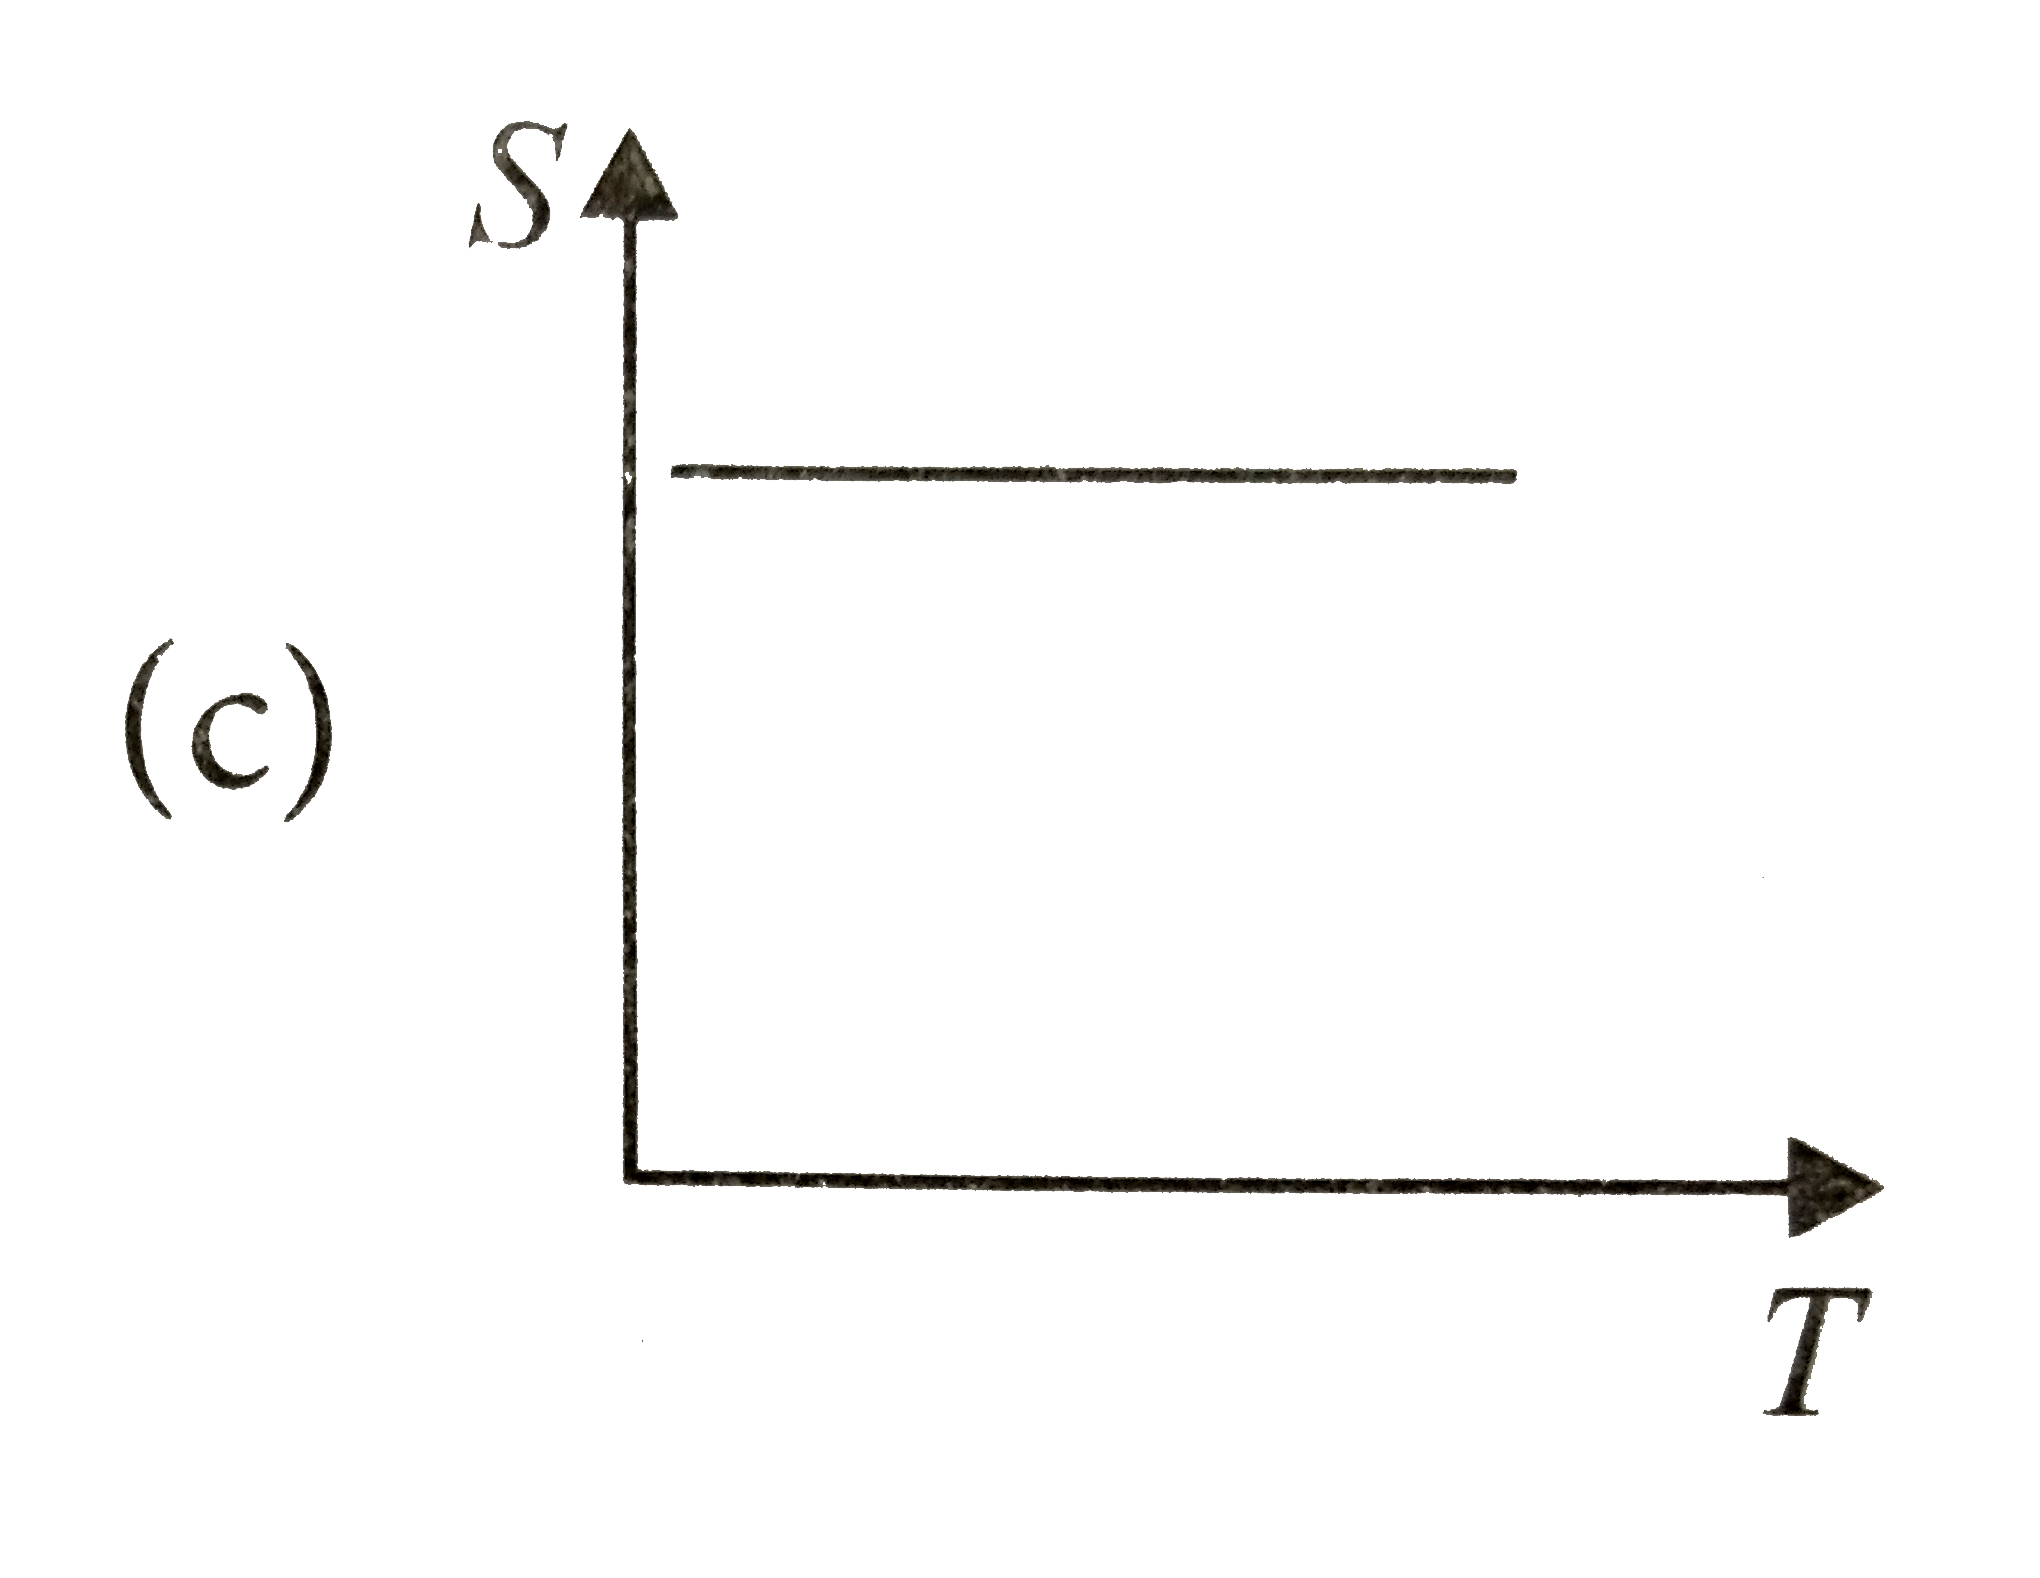 D
D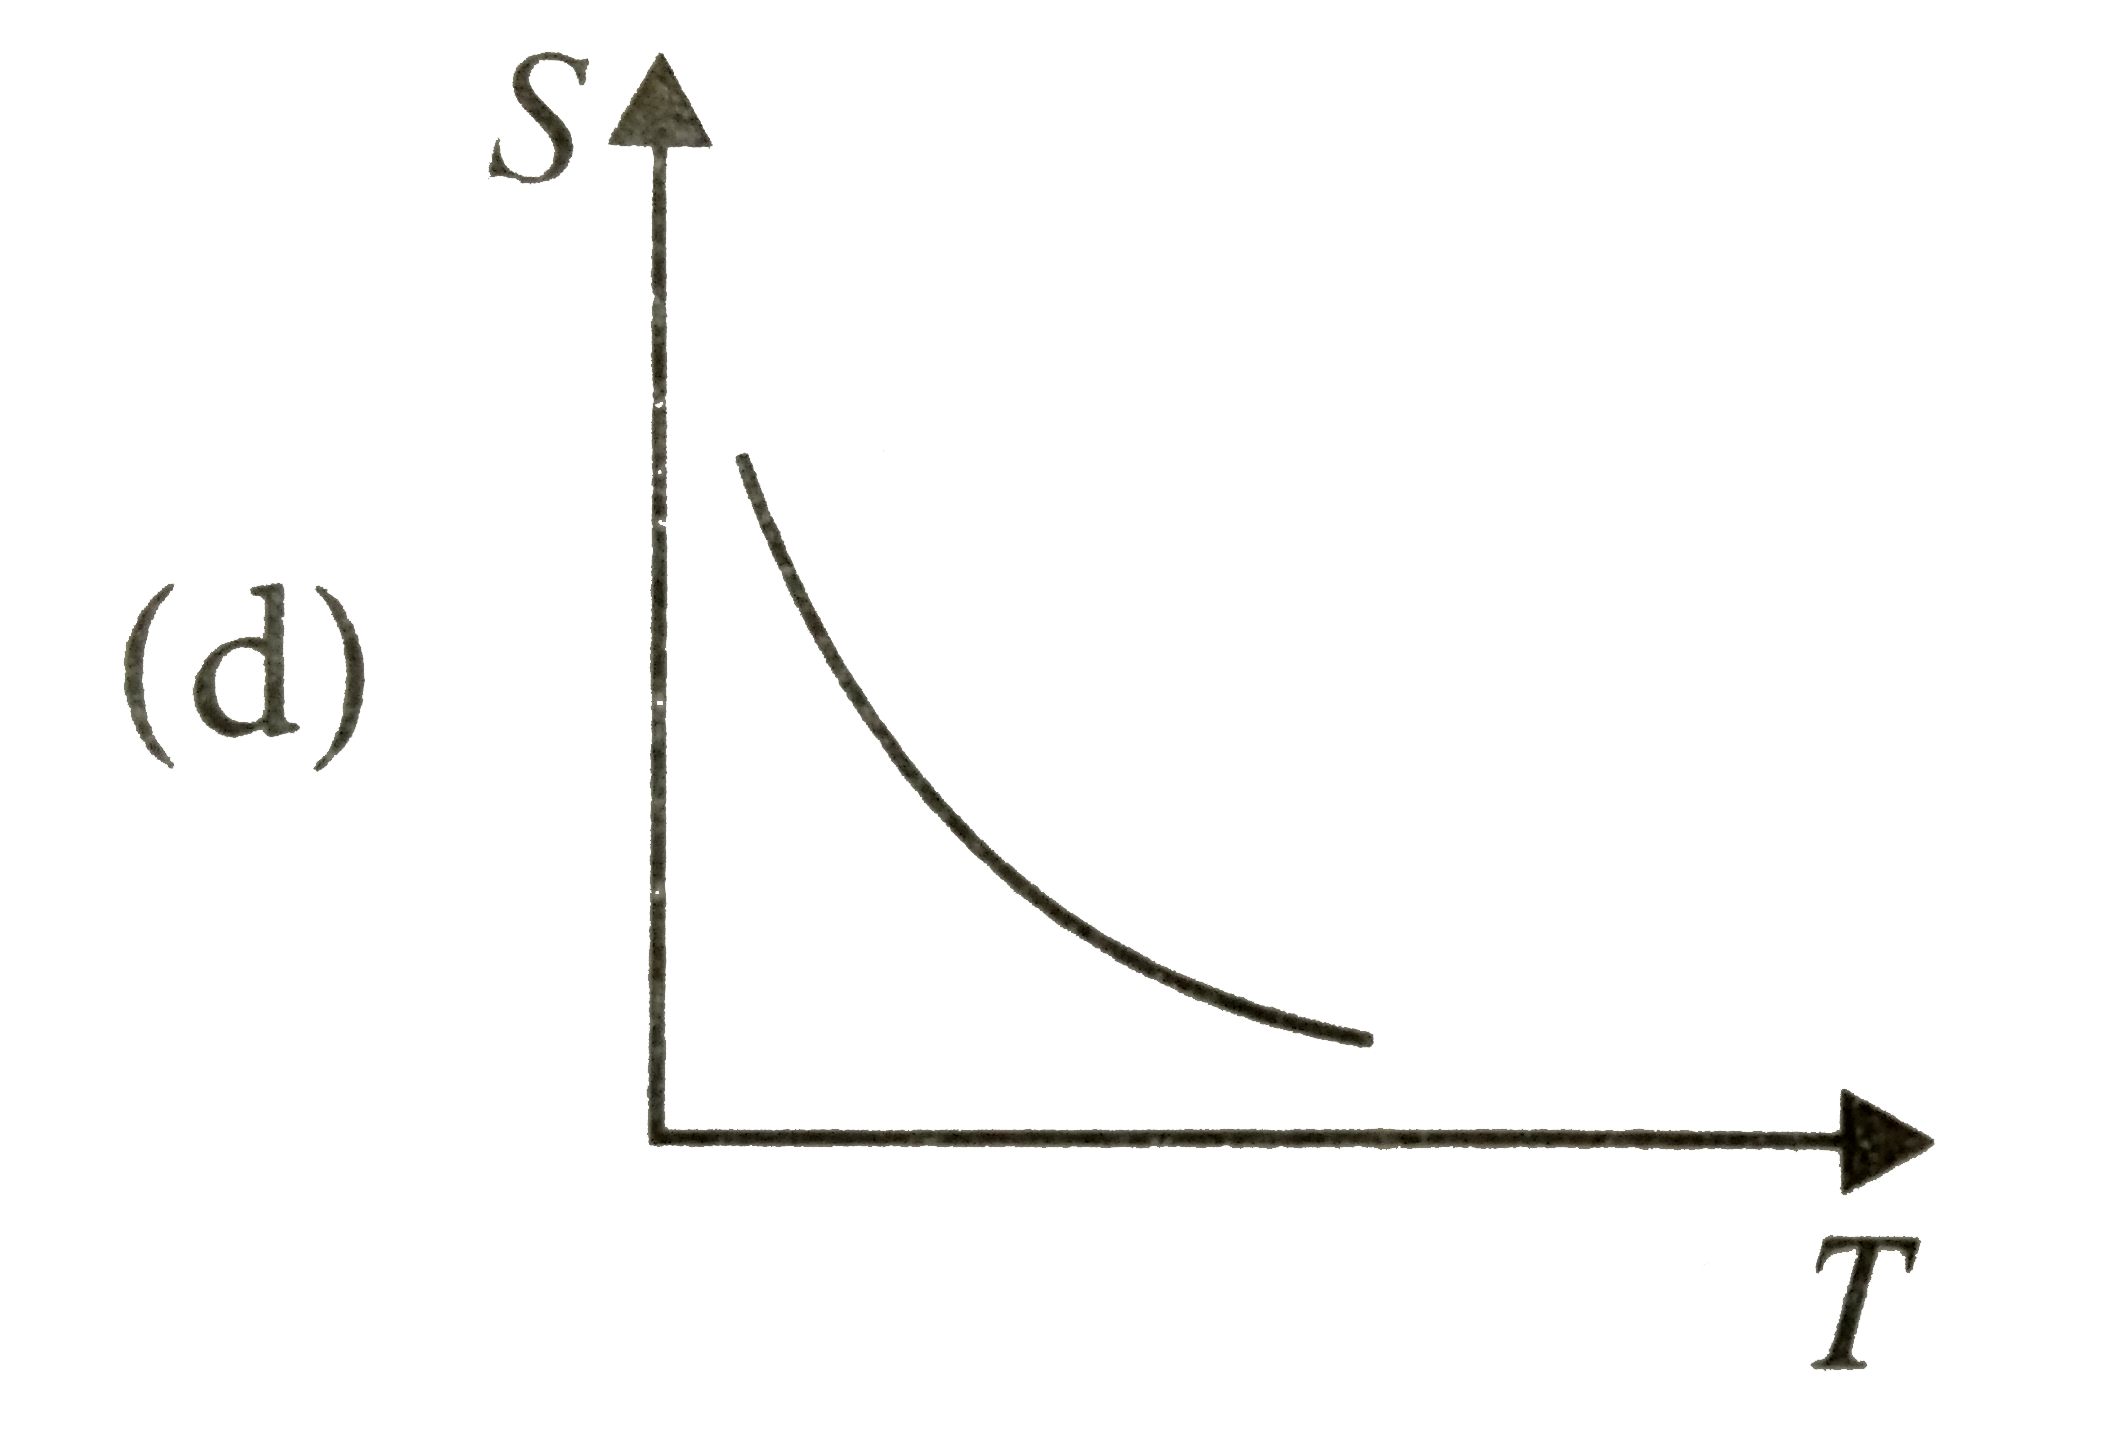
The difference in the variation of resistance with temperature in a metal and a semiconductor arises essentially due to the difference in the
View SolutionThe difference in the variation of resistance with temperature in a metal and a semiconductor arises essentially due to the difference in the
View SolutionWhich of the following graph represents the variation of resistivity (ρ) with temperature (T) for copper?
View SolutionEach figure in Column - I shows the variation of resistance with temperature. Some materials are mentioned in Column - II. Match Column - I with Column - II.
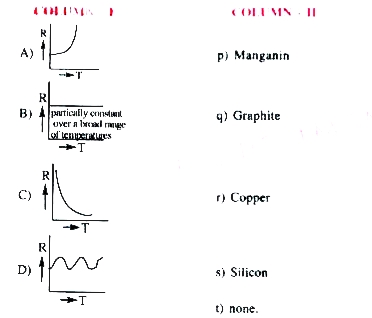
View SolutionThe curve showing the variation of pressure with temperature for a given amount of adsoption is called

View SolutionDraw a plot showing the variation at resistivity of a (i) conductor and (ii) semiconductor, with the increase in temperature.
View Solution
