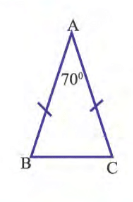
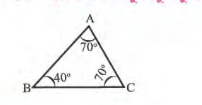
চিত্রে AB=AC , ∠BAC=70∘ , প্রমাণ করো যে , অসমান বাহুটি ত্রিভুজের বৃহত্তম বাহু |
Step by step video & image solution for চিত্রে AB=AC , angleBAC=70^@ , প্রমাণ করো যে , অসমান বাহুটি ত্রিভুজের বৃহত্তম বাহু | by Maths experts to help you in doubts & scoring excellent marks in Class 8 exams.
Updated on:21/07/2023Topper's Solved these Questions
- ত্রিভুজের কোন ও বাহুর মধ্যে সম্পর্ক যাচাইBook:NCERT BANGLISH (BANGLISH MEDIUM)Chapter:ত্রিভুজের কোন ও বাহুর মধ্যে সম্পর্ক যাচাইExercise:EXERCISE
Explore 41 Videos
- ত্রিভুজ অঙ্কনBook:NCERT BANGLISH (BANGLISH MEDIUM)Chapter:ত্রিভুজ অঙ্কনExercise:EXERCISE
Explore 6 Videos
- ত্রিভুজের দুটি বাহু ও তাদের বিপরীত কোনের সম্পর্কBook:NCERT BANGLISH (BANGLISH MEDIUM)Chapter:ত্রিভুজের দুটি বাহু ও তাদের বিপরীত কোনের সম্পর্কExercise:EXERCISE
Explore 10 Videos
Similar Questions
△ABC এর অন্তঃস্থ একটি বিন্দু O , প্রমাণ করো যে ∠BOC>∠BAC
View Solutionএকটি ত্রিভুজ আঁকো যার দুটি বাহুর দৈর্ঘ্য 5 সেমি ও 10 সেমি এবং 10 সেমি দৈর্ঘ্যের বাহুর বিপরীত কোণ 100^@ |
View Solutionনীচের সমদ্বিবাহু ত্রিভুজটি দেখো ও না মেপে ত্রিভুজটির কোন দুটি বাহু সমান হবে লেখো |

View SolutionIdentify the cell organelle 'A' :-
ltimg src="https://d10lpgp6xz60nq.cloudfront.net/physics_images/ALN_BIO_C10_E08_018_Q01.png" width="80%"gt
View SolutionHow many lines of symmetry does the above figure have ?
View SolutionWhich of the following are correct chain isomers of butane ? (i)
View SolutionDetermine the point of symmetry of a regular hexagon.
View SolutionDtermine the images of the following figure about the given line :
View SolutionIn the figure above (not to scale), ¯¯¯¯¯¯AB⊥¯¯¯¯¯¯CDandAD is the bisector of ∠BAE.AB=3cm and AC=5cm. Find CD.
View SolutionMatch the following Column A to Column B

View SolutionMatch the following Column A to Column B

View SolutionMatch the following Column A to Column B

View SolutionFind the area of the figure given below.

View SolutionThe inequation represented by the graph given below is :
View SolutionThe inequation that best describes the graph given below is _________
View SolutionThe inequation that best describes the following graph is _________
View Solution
