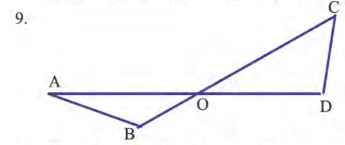
চিত্রে , AB=CD,∠OCD>∠COD এবং ∠OAB<∠AOB প্রমাণ করো যে OB<OD |
Step by step video & image solution for চিত্রে , AB=CD,angleOCDgtangleCOD এবং angleOABltangleAOB প্রমাণ করো যে OBltOD | by Maths experts to help you in doubts & scoring excellent marks in Class 8 exams.
Updated on:21/07/2023Topper's Solved these Questions
- ত্রিভুজের কোন ও বাহুর মধ্যে সম্পর্ক যাচাইBOOK - NCERT BANGLISH (BANGLISH MEDIUM)CHAPTER - ত্রিভুজের কোন ও বাহুর মধ্যে সম্পর্ক যাচাইEXERCISE - EXERCISE
41 Videos
- ত্রিভুজ অঙ্কনBOOK - NCERT BANGLISH (BANGLISH MEDIUM)CHAPTER - ত্রিভুজ অঙ্কনEXERCISE - EXERCISE
6 Videos
- ত্রিভুজের দুটি বাহু ও তাদের বিপরীত কোনের সম্পর্কBOOK - NCERT BANGLISH (BANGLISH MEDIUM)CHAPTER - ত্রিভুজের দুটি বাহু ও তাদের বিপরীত কোনের সম্পর্কEXERCISE - EXERCISE
10 Videos
Similar Questions
△ABC এর অন্তঃস্থ একটি বিন্দু O , প্রমাণ করো যে ∠BOC>∠BAC
View Solutionএকটি ত্রিভুজ আঁকো যার দুটি বাহুর দৈর্ঘ্য 5 সেমি ও 10 সেমি এবং 10 সেমি দৈর্ঘ্যের বাহুর বিপরীত কোণ 100^@ |
View Solutionনীচের সমদ্বিবাহু ত্রিভুজটি দেখো ও না মেপে ত্রিভুজটির কোন দুটি বাহু সমান হবে লেখো |

View SolutionIn the given figure (not to scale), O is the centre of the circle. A,B,C and D are concyclic and AB=CD . If /_MON =120^(@) , then find /_ OPN .
View SolutionHow many lines of symmetry does the above figure have ?
View SolutionWhich of the following are correct chain isomers of butane ? (i)
View SolutionDetermine the point of symmetry of a regular hexagon.
View SolutionDtermine the images of the following figure about the given line :
View SolutionIn the figure above (not to scale), ¯¯¯¯¯¯AB⊥¯¯¯¯¯¯CDandAD is the bisector of ∠BAE.AB=3cm and AC=5cm. Find CD.
View SolutionMatch the following Column A to Column B

View SolutionMatch the following Column A to Column B

View SolutionMatch the following Column A to Column B

View SolutionFind the area of the figure given below.

View SolutionThe area of the shaded part in the figure given below is ______.

View SolutionThe inequation represented by the graph given below is :
View SolutionThe inequation that best describes the graph given below is _________
View Solution
