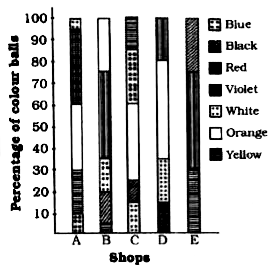
In the following questions, the followIng Bar Diagram shows the percentage of 7 coloured balls sold in 5 shops A, B, C, D and E. Study the graph and answer. all the questions.
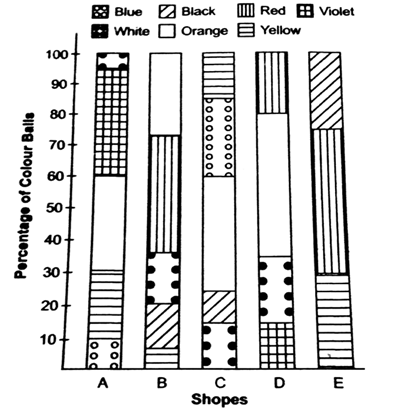
The ratio of total percentage of red balls and total percentage of orange balls is :
The correct Answer is:D
Step by step video, text & image solution for In the following questions, the followIng Bar Diagram shows the percentage of 7 coloured balls sold in 5 shops A, B, C, D and E. Study the graph and answer. all the questions. The ratio of total percentage of red balls and total percentage of orange balls is : by Maths experts to help you in doubts & scoring excellent marks in Class 14 exams.
Updated on:21/07/2023Similar Questions
Directions: The following bar graph shows the number of pages in five different books (viz. A, B, C, D and E). Study the graph carefully and answer the following questions.
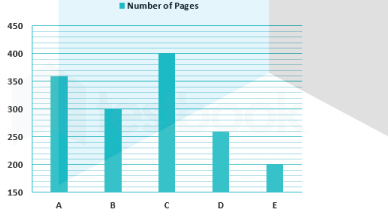
What is the ratio of total number of pages in book B and E together to the total number of pages in book C and D together?
View SolutionStudy the graph and answer the question
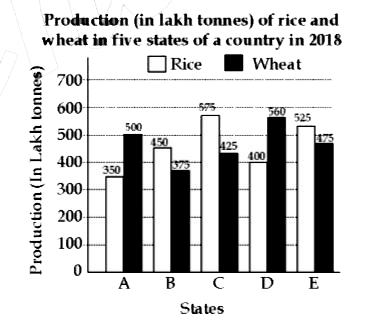
the ratio of the total production of rice in states C and E to the total production of wheat in states B and D is……..
View Solution
Knowledge Check
In the following questions, the followIng Bar Diagram shows the percentage of 7 coloured balls sold in 5 shops A, B, C, D and E. Study the graph and answer. all the questions.
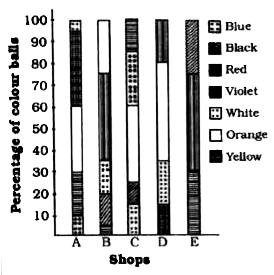
The shops having equal percentage of white balls are :AA and CBC and ECB and CDA and BIn the following questions, the followIng Bar Diagram shows the percentage of 7 coloured balls sold in 5 shops A, B, C, D and E. Study the graph and answer. all the questions.
What fraction of the total percentage of colour balls is to the percentage of total yellow balls?A750B320C425D13100In the following questions, the followIng Bar Diagram shows the percentage of 7 coloured balls sold in 5 shops A, B, C, D and E. Study the graph and answer. all the questions.
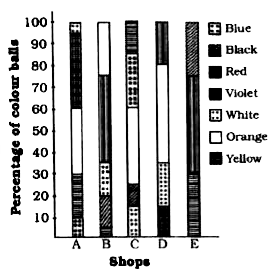
In shop A, the ratio of percentage of violet balls and yellow balls is:A2:7B7:4C6:1D2:4
In the following questions, the followIng Bar Diagram shows the percentage of 7 coloured balls sold in 5 shops A, B, C, D and E. Study the graph and answer. all the questions.

The difference between total number of percentage of violet balls and total number of percentage of blue balls is:
View SolutionStudy the bar diagram and answer the questions.
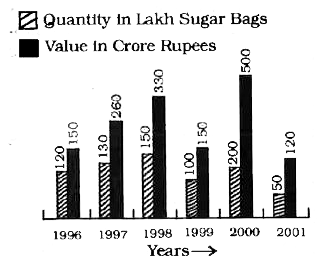
The approximate percentage incresase in value from 1997 to 1998 was
View SolutionThe bar diagram shows the monthly expenditure of a company. Study the graph and answer the questions.
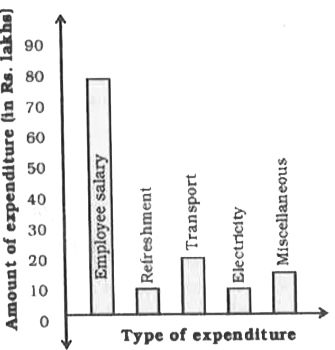
The percentage of money spent on miscellaneous is
View SolutionThe bar diagram shows the monthly expenditure of a company. Study the graph and answer the questions.
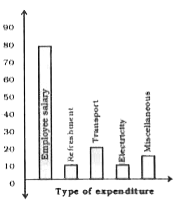
The percentage of money spent on miscellaneous is
View SolutionBar diagram showing the effect of literacy drive within both sexes in 5 units study the bar diagram and answer the questions.
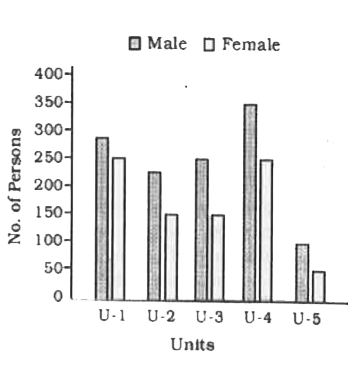
The percentage of males in u - 4 is
View Solution
