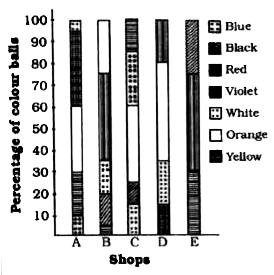
In the following questions, the followIng Bar Diagram shows the percentage of 7 coloured balls sold in 5 shops A, B, C, D and E. Study the graph and answer. all the questions.
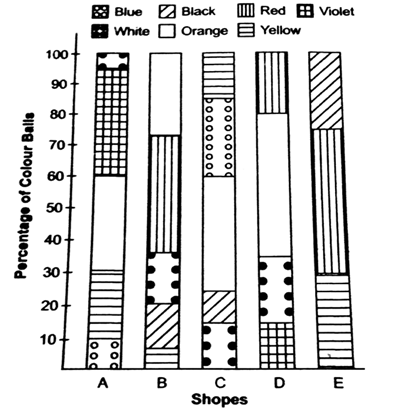
The difference between total number of percentage of violet balls and total number of percentage of blue balls is:
10
15
25
40
The correct Answer is:B
Step by step video, text & image solution for In the following questions, the followIng Bar Diagram shows the percentage of 7 coloured balls sold in 5 shops A, B, C, D and E. Study the graph and answer. all the questions. The difference between total number of percentage of violet balls and total number of percentage of blue balls is: by Maths experts to help you in doubts & scoring excellent marks in Class 14 exams.
Updated on:21/07/2023Similar Questions
Study the following graph and answer the question based on the graph.
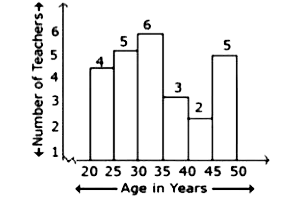
What percentage of the total number of teachers are aged less than 45 years?
View SolutionStudy the following bar graph and answer the questions given below.
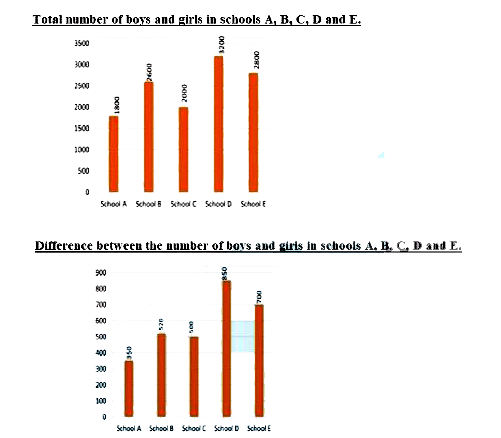
The number of boys in school B is what percentage of the total number of students in that school ?
View Solution
Knowledge Check
In the following questions, the followIng Bar Diagram shows the percentage of 7 coloured balls sold in 5 shops A, B, C, D and E. Study the graph and answer. all the questions.
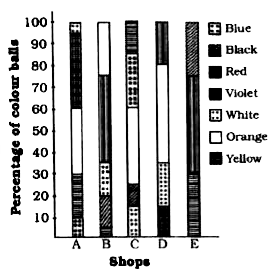
In shop A, the ratio of percentage of violet balls and yellow balls is:A2:7B7:4C6:1D2:4In the following questions, the followIng Bar Diagram shows the percentage of 7 coloured balls sold in 5 shops A, B, C, D and E. Study the graph and answer. all the questions.
The shops having equal percentage of white balls are :AA and CBC and ECB and CDA and BIn the following questions, the followIng Bar Diagram shows the percentage of 7 coloured balls sold in 5 shops A, B, C, D and E. Study the graph and answer. all the questions.

The ratio of total percentage of red balls and total percentage of orange balls is :A1:1B4:5C9:11D7:9
Directions: The following bar graph shows the number of pages in five different books (viz. A, B, C, D and E). Study the graph carefully and answer the following questions.
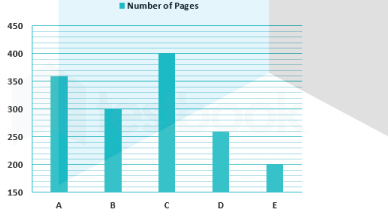
What is the ratio of total number of pages in book B and E together to the total number of pages in book C and D together?
View SolutionIn the following questions, the followIng Bar Diagram shows the percentage of 7 coloured balls sold in 5 shops A, B, C, D and E. Study the graph and answer. all the questions.
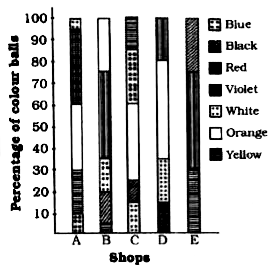
What fraction of the total percentage of colour balls is to the percentage of total yellow balls?
View SolutionStudy the bar diagram and answer the questions.
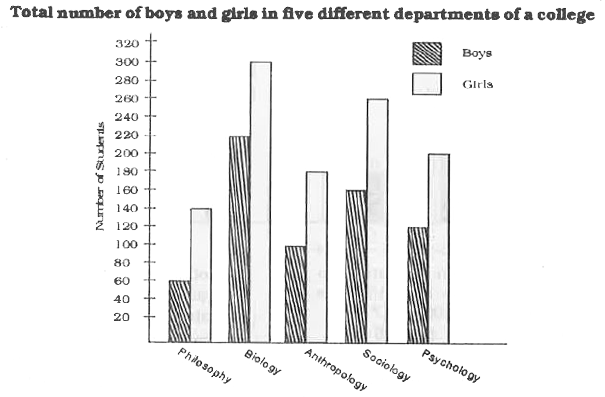
The difference between the total number of bys and the total number of girls from all the Departments together is
View SolutionThe following bar-diagram shows total number of males and females in five different organisations. Study it carefully to answer the questions.
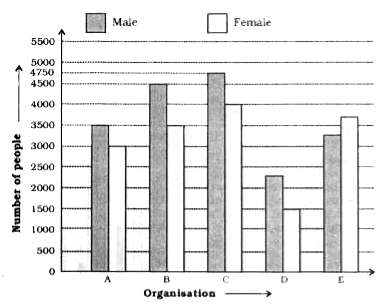
What is the difference between the total number of females and the total number of males from all the organisations together?
View SolutionThe pie-chart shows the percentage of literate and illiterate males and females in a state. Study the diagram and answer the following questions.
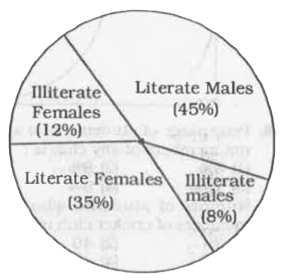
If the total number is 35000, then the difference between the number of literate males and that of literate females is
View Solution
