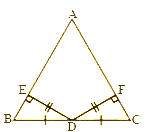
In the adjacent figure ΔABC,D is the midpoint of BC. DE⊥AB,DF⊥AC and DE=DF. Show that ΔBED≅ΔCFD.
 Solution in Gujrati
Step by step video & image solution for In the adjacent figure DeltaABC, D is the midpoint of BC. DE_|_AB, DF_|_AC and DE = DF. Show that DeltaBED ~= Delta CFD. by Maths experts to help you in doubts & scoring excellent marks in Class 9 exams.
Updated on:21/07/2023Topper's Solved these Questions
- TRIANGLES BOOK - NCERT GUJARATICHAPTER - TRIANGLES EXERCISE - EXERCISE - 7.2
5 Videos
- TRIANGLES BOOK - NCERT GUJARATICHAPTER - TRIANGLES EXERCISE - EXERCISE - 7.3
7 Videos
- TRIANGLES BOOK - NCERT GUJARATICHAPTER - TRIANGLES EXERCISE - DO THIS
10 Videos
- THE ELEMENTS OF GEOMETRY BOOK - NCERT GUJARATICHAPTER - THE ELEMENTS OF GEOMETRY EXERCISE - BRAIN TEASER
2 Videos
Similar Questions
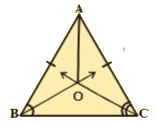
In an isosceles triangle ABC, with AB = AC, the bisectors of ∠Band∠C intersect each other at O. Join A to O. Show that :
(i) OB = OC (ii) AO bisects ∠A

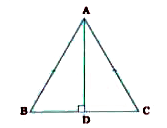
View SolutionAD is an altitude of an isosceles triangle ABC in which AB = AC. Show that: ( i ) AD bisects BC ( ii) AD bisects ∠ A

View SolutionThere are some statements given below. Write whether they are true or false :
Two circle are always congruent.
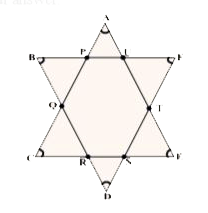
View SolutionWhat is the measure of ∠A+∠B+∠C+∠D+∠E+∠F in the figure given below. Give reason to your answer.

View SolutionHow many lines of symmetry does the above figure have ?
View SolutionDetermine the point of symmetry of a regular hexagon.
View SolutionDtermine the images of the following figure about the given line :
View SolutionMatch the following Column A to Column B

View SolutionMatch the following Column A to Column B

View SolutionMatch the following Column A to Column B

View SolutionFind the area of the figure given below.

View SolutionThe area of the shaded part in the figure given below is ______.

View SolutionThe inequation represented by the graph given below is :
View SolutionThe inequation that best describes the graph given below is _________
View SolutionThe inequation that best describes the following graph is _________
View SolutionWhich inequations represent the shaded region in the given figure
View Solution
