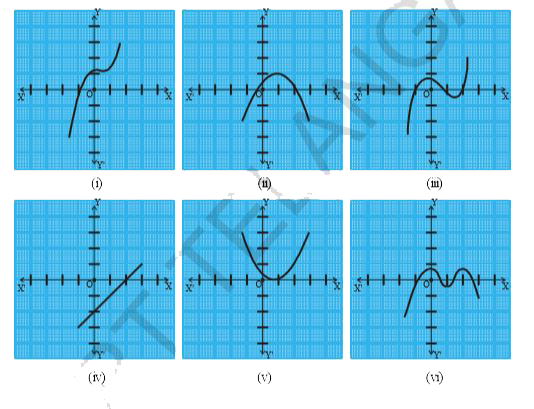
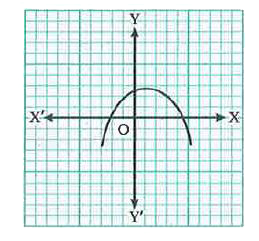
Look at graphs in the figures below. Each is the graph of y=p(x), where p(x) is a polynomial. In each of the graphs, find the number of zeroes of p(x) in the given range of x .
 Solution in Gujrati
The correct Answer is:(i) X-axis at one point only.
(ii) X- axis at two points.
(iii) 3
(iv) 1
(v) 1
(vi) 4.
Step by step video, text & image solution for Look at graphs in the figures below. Each is the graph of y=p(x), where p(x) is a polynomial. In each of the graphs, find the number of zeroes of p(x) in the given range of x . by Maths experts to help you in doubts & scoring excellent marks in Class 10 exams.
Topper's Solved these Questions
- BOOK - NCERT GUJARATICHAPTER - POLYNOMIALSEXERCISE - DO THIS15videos
POLYNOMIALS
- BOOK - NCERT GUJARATICHAPTER - POLYNOMIALSEXERCISE - TRY THIS10videos
POLYNOMIALS
- BOOK - NCERT GUJARATICHAPTER - MENSURATIONEXERCISE - OPTIONAL EXERCISE5videos
MENSURATION
- BOOK - NCERT GUJARATICHAPTER - PROBABILITYEXERCISE - THINK AND DISCUSS3videos
PROBABILITY
Similar Questions
State which of the following are polynomials and which are not ? Give reasons.
2x301:54View SolutionWrite 3 different quadratic, cubic and 2 linear polynomials with different number of terms.
02:10View SolutionA golf ball has diameter equal to 4.1 cm. Its surface has 150 dimples each of radius 2 mm. Calculate total surface area which is exposed to the surroundings. (Assume that the dimples are all hemispherical) [π=227]
02:17View SolutionWhy is tossing a coin considered to be a fair way of deciding which team should get the ball at the beginning of any game
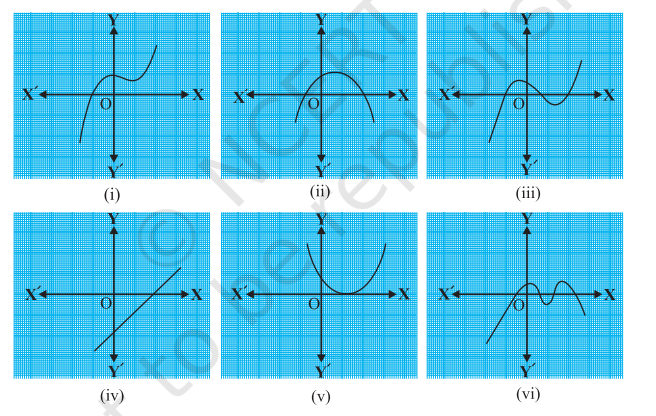
02:10View SolutionLook at the graphs in Figure given below. Each is the graph of y=p(x), where p(x) is a polynomial. For each of the graphs, find the number of zeroes of p(x).
 02:43View Solution
The inequation represented by the graph given below is :
02:16View SolutionThe inequation that best describes the graph given below is _________
04:05View SolutionThe inequation that best describes the following graph is _________
02:01View Solutionनीचे दी गई आकृति 2.9 में , ग्राफों को देखिए । प्रत्येक आकृति y=p(x) जहाँ p(x) एक बहुपद है , का ग्राफ है । ग्राफ है । ग्राफों से प्रत्येक के लिए p(x) के शून्यको की संख्या ज्ञात कीजिए ।
 01:33View Solution
Look at the graph in the figures given below. Each is the graph of y = p(x), where p(x) is a polynomial. In each of the graphs, find the number of zeroes of p(x) in the given range of x.
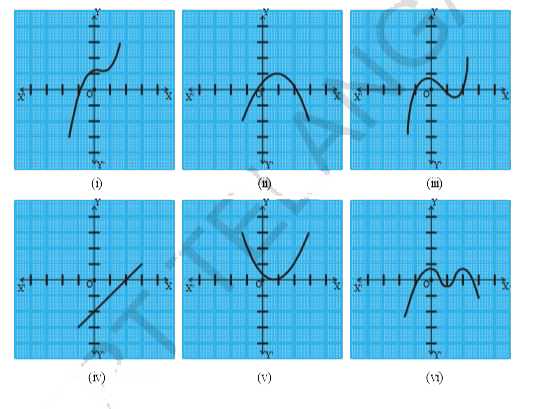
01:57View SolutionLook at graphs in the figures below. Each is the graph of y=p(x), where p(x) is a polynomial. In each of the graphs, find the number of zeroes of p(x) in the given range of x .
 02:44View Solution
x3−2x+5 find coefficient of x2,x1,x0.
02:28View SolutionLook at the graphs in Figure given below. Each is the graph of y=p(x), where p(x) is a polynomial. For each of the graphs, find the number of zeroes of p(x).
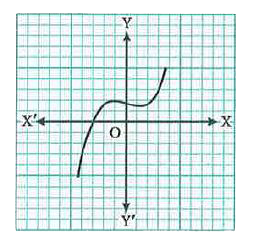
02:23View SolutionLook at the graphs in the figures given below. Each is the graph of y=p(x), where p(x) is a polynomial. For each of the graphs, find the number of zeroes of p(x).
 02:23View Solution
Look at the graphs in the figures given below. Each is the graph of y=p(x), where p(x) is a polynomial. For each of the graphs, find the number of zeroes of p(x).
 02:33View Solution

