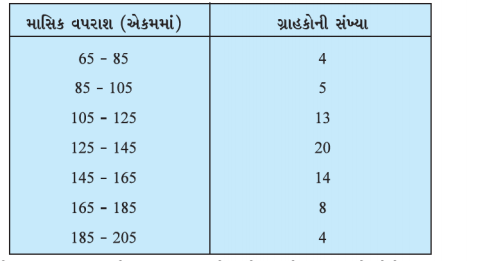
The following table gives production yield per hectare of wheat of 100 farms of a village.

Change the distribution to a more than type distribution , and draw its ogive.Solution in Gujrati
The correct Answer is:(##NCERTGUJMATX_C14E04003_A01##)
Now, draw the ogive by plotting the points : (50, 100), (55, 98), (60, 90), (65, 78), (70, 54) and (75, 16).
Step by step video, text & image solution for The following table gives production yield per hectare of wheat of 100 farms of a village. Change the distribution to a more than type distribution , and draw its ogive. by Maths experts to help you in doubts & scoring excellent marks in Class 10 exams.
Updated on:21/07/2023Topper's Solved these Questions
- STATISTICSBOOK - NCERT GUJARATICHAPTER - STATISTICSEXERCISE - Do this
3 Videos
- STATISTICSBOOK - NCERT GUJARATICHAPTER - STATISTICSEXERCISE - THINK AND DISCUSS
8 Videos
- STATISTICSBOOK - NCERT GUJARATICHAPTER - STATISTICSEXERCISE - Exercise 14.3
7 Videos
- SIMILAR TRIANGLES BOOK - NCERT GUJARATICHAPTER - SIMILAR TRIANGLES EXERCISE - TRY THIS
6 Videos
- TANGENTS AND SECANTS TO A CIRCLEBOOK - NCERT GUJARATICHAPTER - TANGENTS AND SECANTS TO A CIRCLEEXERCISE - Try this
2 Videos
Similar Questions
Find the mode of the following data.
5,6,9,10,6,12,3,6,11,10,4,6,7
View SolutionThe mean value can be calculated from both ungrouped and grouped data. Which one do you think is more accurate? Why?
View SolutionThe following frequency distribution gives the monthly comsumption of electricity of 68 consumers of a locality. Find the median, mean and mode of the data and compare them.

View SolutionIn triangle ΔPQR, E and F are points on the sides PQ and PR respectively. State whether EF ||QR or not?
(i) PE = 3.9 cm EQ = 3 cm PF = 3.6 cm and FR = 2.4 cm
View SolutionDraw a pair of radii OA and OB in a circle such that ∠BOA=120∘. Draw the bisector of ∠BOA and draw lines perpendiculars to OA and OB at A and B. These lines meet on the bisector of ∠BOA at a point which is the external point and the perpendicular lines are the required tangents. Construct and Justify.
View SolutionThe following table gives production yield per hectare of wheat of 100 farms of a village.Change the distribution to a more than type distribution, and draw its ogive.
View SolutionWhich of the following are correct chain isomers of butane ? (i)
View SolutionDetermine the point of symmetry of a regular hexagon.
View SolutionDtermine the images of the following figure about the given line :
View SolutionDraw the bisector of ∠AOB=58∘
ltimg src="https://d10lpgp6xz60nq.cloudfront.net/physics_images/PS_MATH_VII_C05_S01_009_Q01.png" width="80%"gt
View SolutionMatch the following Column A to Column B

View SolutionMatch the following Column A to Column B

View SolutionMatch the following Column A to Column B

View SolutionThe inequation represented by the graph given below is :
View SolutionThe inequation that best describes the graph given below is _________
View Solution
