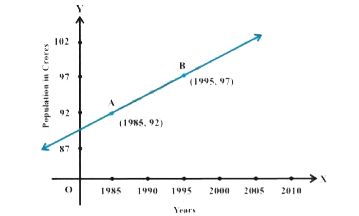
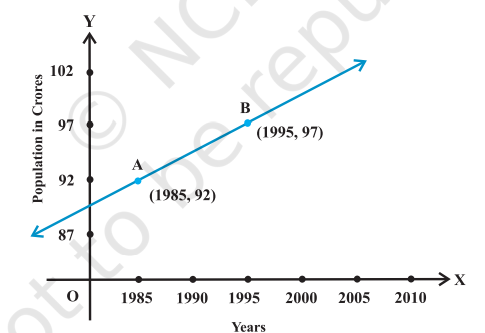
Consider the following population and year graph (Fig 10.10), find the slope of the line AB and using it, find what will be the population in the year 2010?

The correct Answer is:12,104.5 Crores
Topper's Solved these Questions
- STRAIGHT LINESBOOK - NCERT GUJARATICHAPTER - STRAIGHT LINESEXERCISE - EXERCISE 10.2
19 Videos
- STRAIGHT LINESBOOK - NCERT GUJARATICHAPTER - STRAIGHT LINESEXERCISE - EXERCISE 10.3
18 Videos
- STRAIGHT LINESBOOK - NCERT GUJARATICHAPTER - STRAIGHT LINESEXERCISE - Miscellaneous Exercise on Chapter 10
24 Videos
- STATISTICSBOOK - NCERT GUJARATICHAPTER - STATISTICSEXERCISE - Miscellaneous Exercise On Chapter 15
7 Videos
- TRIGONOMETRIC FUNCTIONS BOOK - NCERT GUJARATICHAPTER - TRIGONOMETRIC FUNCTIONS EXERCISE - MISCELLANEOUS EXAMPLES
10 Videos
Similar Questions
Consider the following population and year graph, find the slope of the line AB and using it, find what will be the population in the year 2010?

View SolutionConsider the following population and year graph: find the slope of the line AB and using it find what will be the population in the year 2010.
View SolutionConsider the following population and year graph: find the slope of the line AB and using it find what will be the population in the year 2010.
View SolutionThe population of a city increases each year by 10%. If the present population of the city is 12000 , then what would be the population after 2 years?
View SolutionThe annual increase in the population of a town is 10%. If the present population of the town is 180000, then what will be its population after two years ?
View SolutionThe population of a city increased by 10% in the previous year. If the present population is 1,32,000, what was the population of the city a year ago?
View SolutionThe population of a town increases by 10% annually. If the present population is 60000, what will be its population after 2 years?
View SolutionThe population of a town increases by 10% annually. If the present population is 60000, what will be its population after 2 years?
View SolutionThe population of a city was 20,000 in the year 1997. It increased at the rate of 5% p.a. Find the population at the end of the year 2000.
View SolutionFour years from now, the population of a colony of bees will reach 1.6×10⁸. If the population of the colony doubles every 2 years, what was the population 4 years ago?
View Solution
