The speed-time graph of a particle moving along a fixed direction is shown in Fig. Obtain the distance traversed by the particle between (a) t = 0 s to 10 s, (b) t = 2s to 6s.

What is the average speed of the particle over the intervals in (a) and (b) ?
(a) , (b)
Topper's Solved these Questions
Similar Questions
The speed-time graph of a particle moving along a fixed direction is shown in figure. Obtain the distance traversed by the particle between (a)t=0s to 10s(b)t=2s to 6s
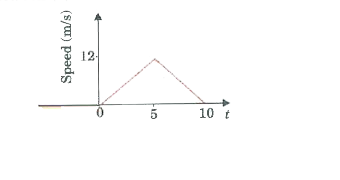
What is the average speed of the particle over the intervals in a and b?View SolutionThe speed-time graph of a particle moving along a fixed direction is shown in the Fig. The distance traversed by the particle between (a) t=0s→10s .
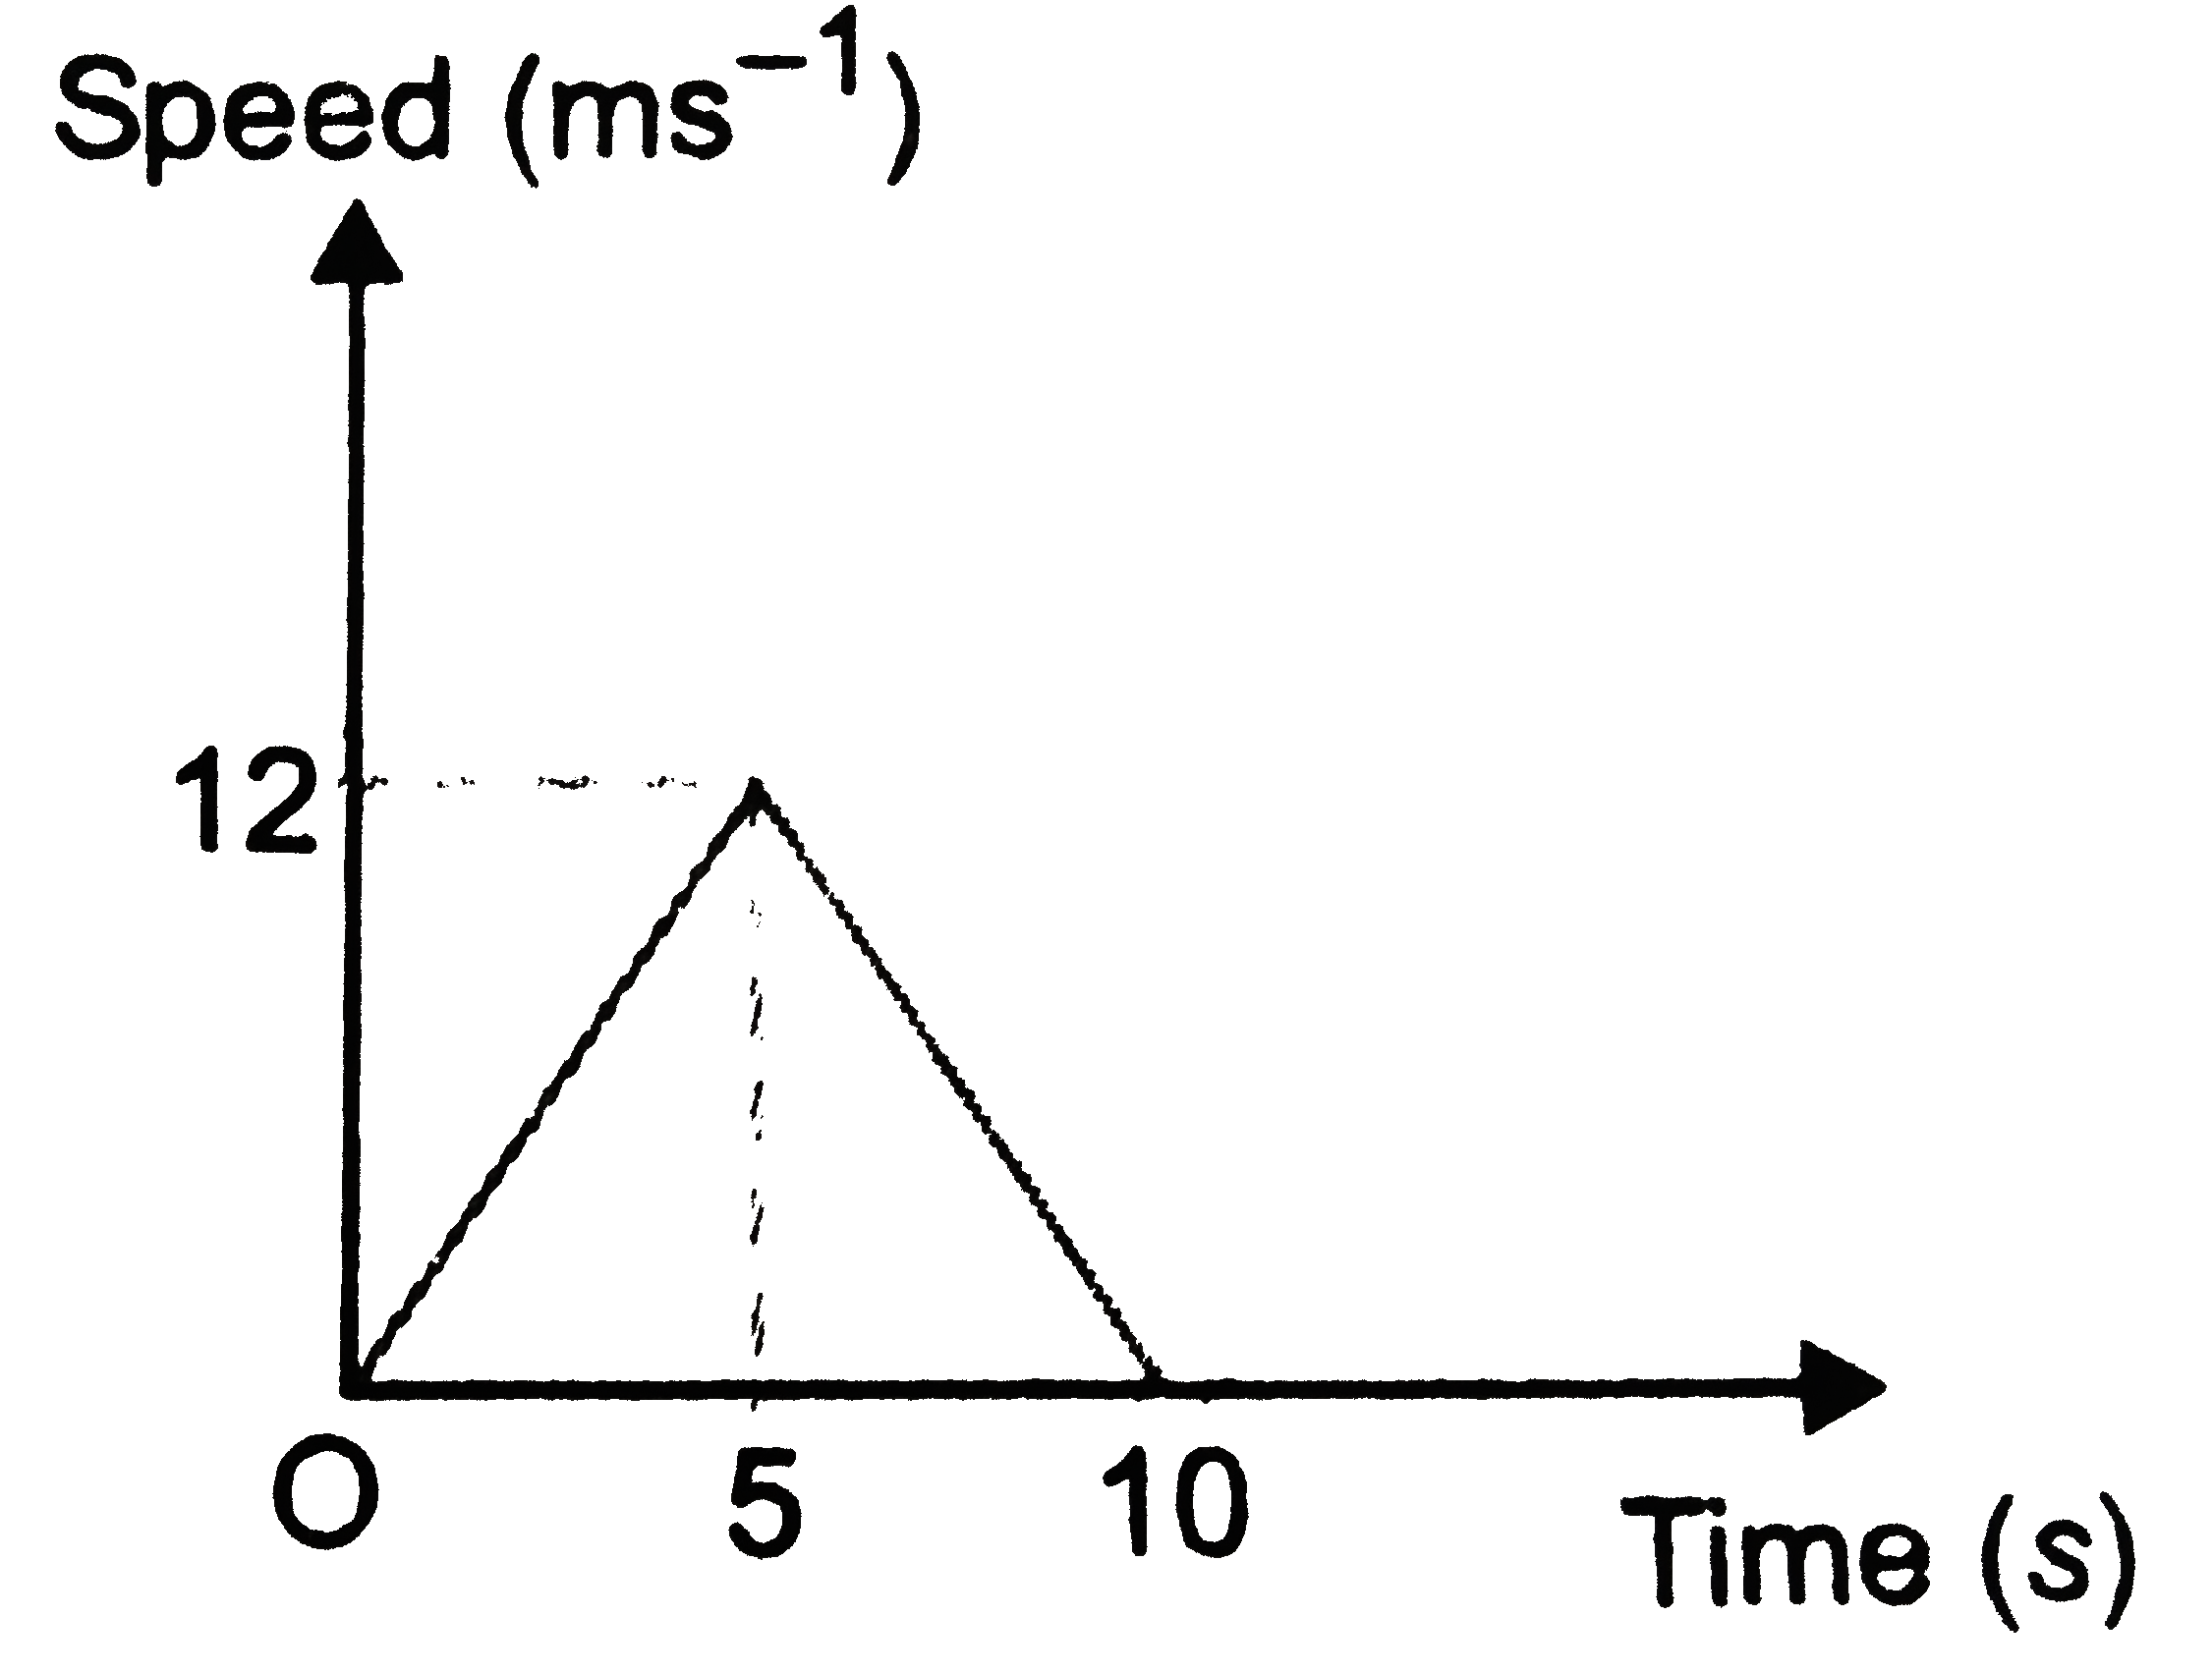 .
what is the average speed of the particle over the intervals?View Solution
Knowledge Check
- Question 1 - Select One
The speed-time graph of a particle moving along a fixed direction as shown in the figure. The distance travelled by the particle between t = 0 s to t = 10 s is
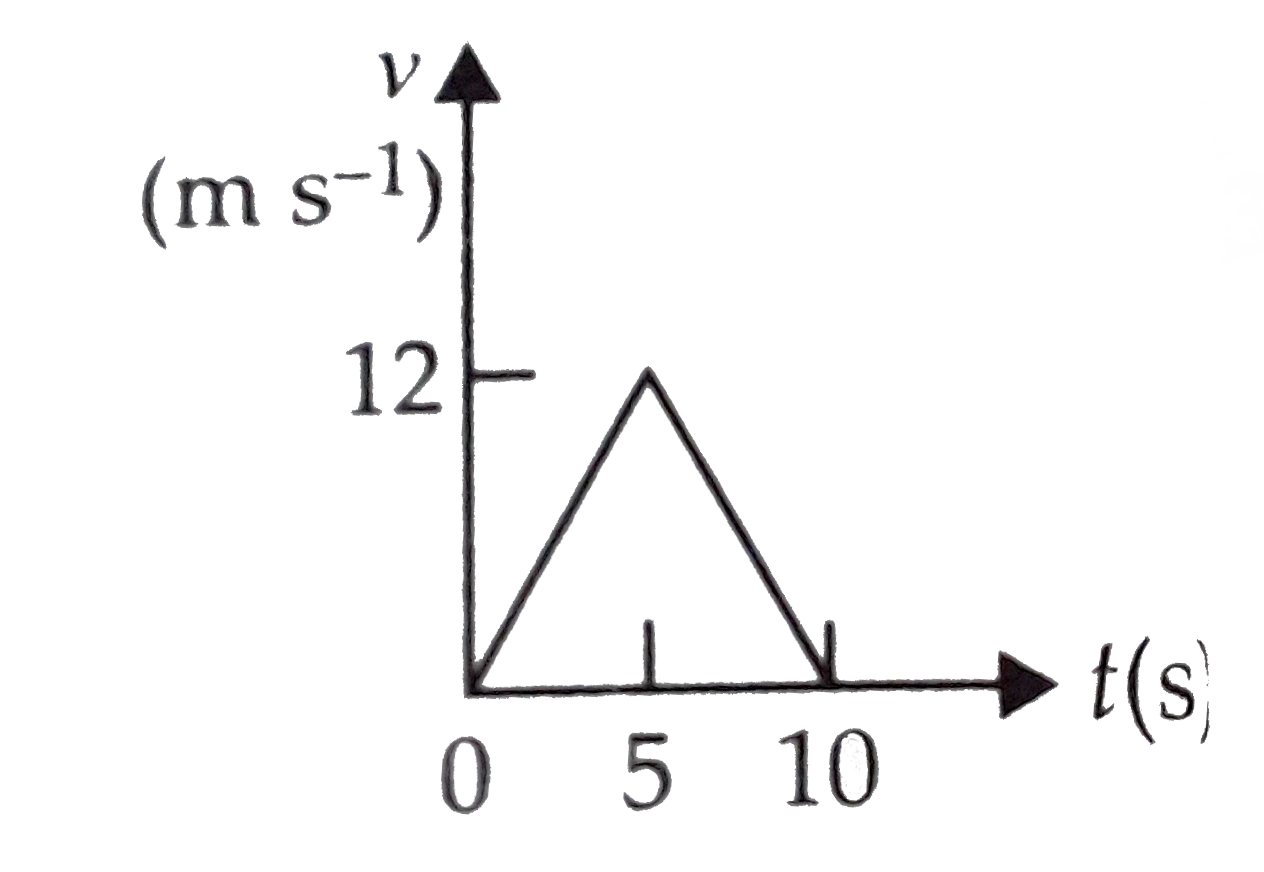 A20 mB40 mC60 mD80 m
 - Question 2 - Select One
The speed-time graph of a particle moving along a fixed direction as shown in the figure. The distance traversed by the particle between t = 0 s to t = 10 s is
 A20 mB40 mC60 mD80 m
 - Question 3 - Select One
The speed-time graph of a particle moving along a fixed direction is shown in the Fig. 2 (CF) . 15. The distance traversed by the particle between t=2s 6s is .
 .A26mB36mC46mD56m
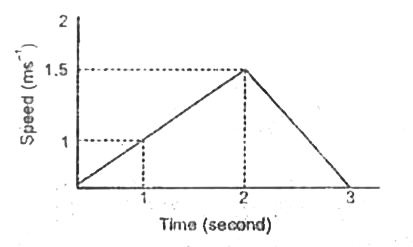
The speed - time graph of a particle moving along a solid curve is shown below. The distance traversed by the particle from t = 0 to t = 3 is
 View Solution
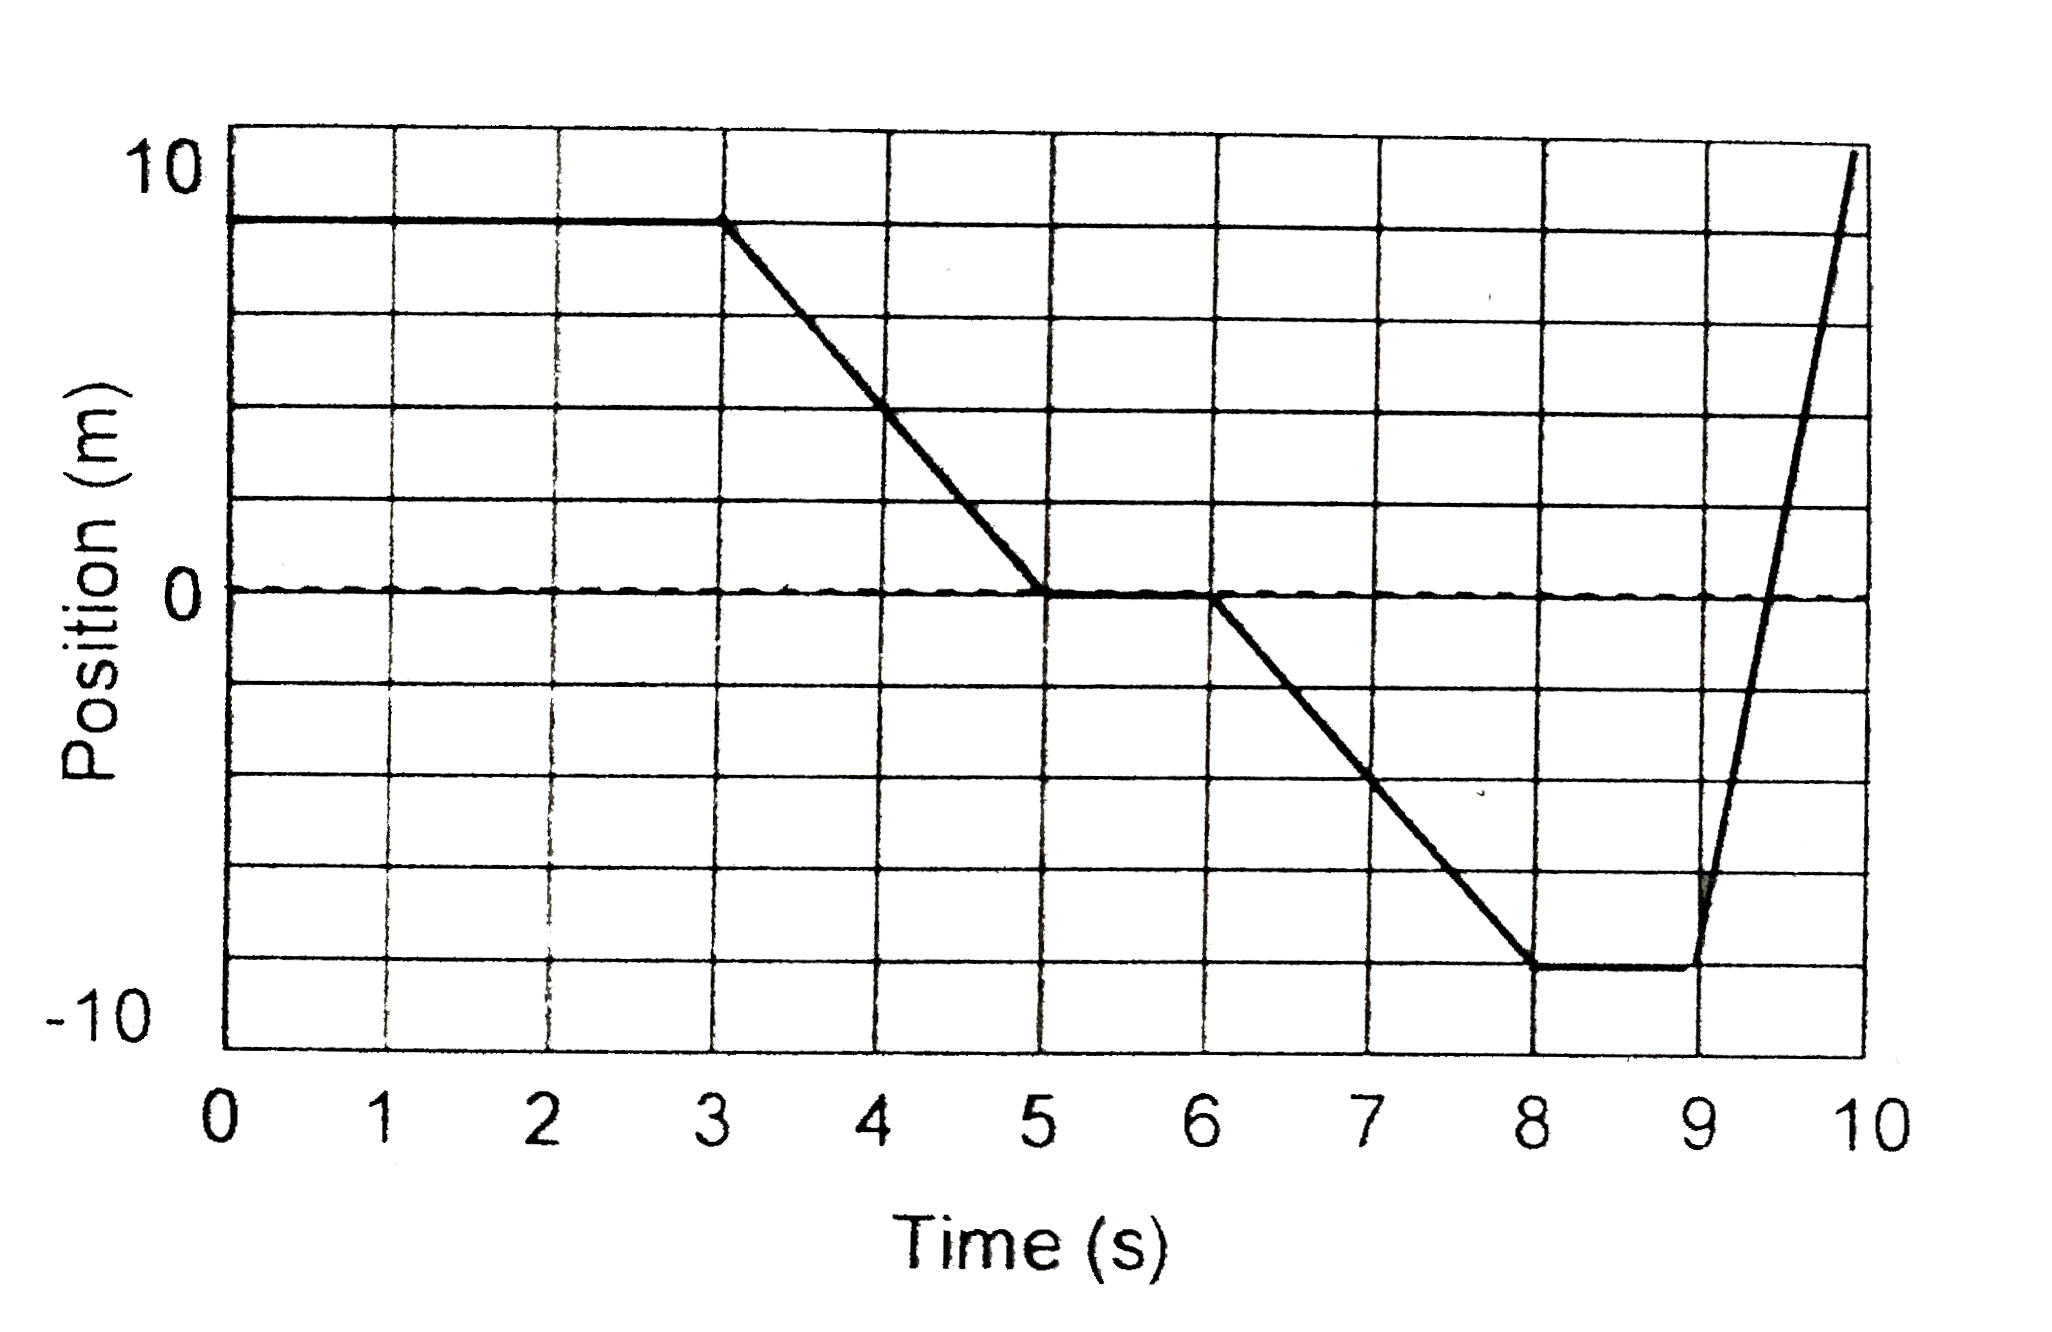
The position versus time graph of a particle moving along a straight line is shown. What is the total distance travelled by the particle from t=0s to t=10s?View SolutionThe speed-time graph of a particle moving along a fixed direction is shown in the Fig. 2 (CF) . 15. The distance traversed by the particle between t=2s and 6s is .
 .View Solution
The speed - time graph of a particle moving along a solid curve is shown below. The distance traversed by the particle from t = 0 to t = 3 is
 View Solution
The position versus time graph of a particle moving along a straight line is shown. What is the total distance travelled by the particle from t=0s to t=10s?View Solution

