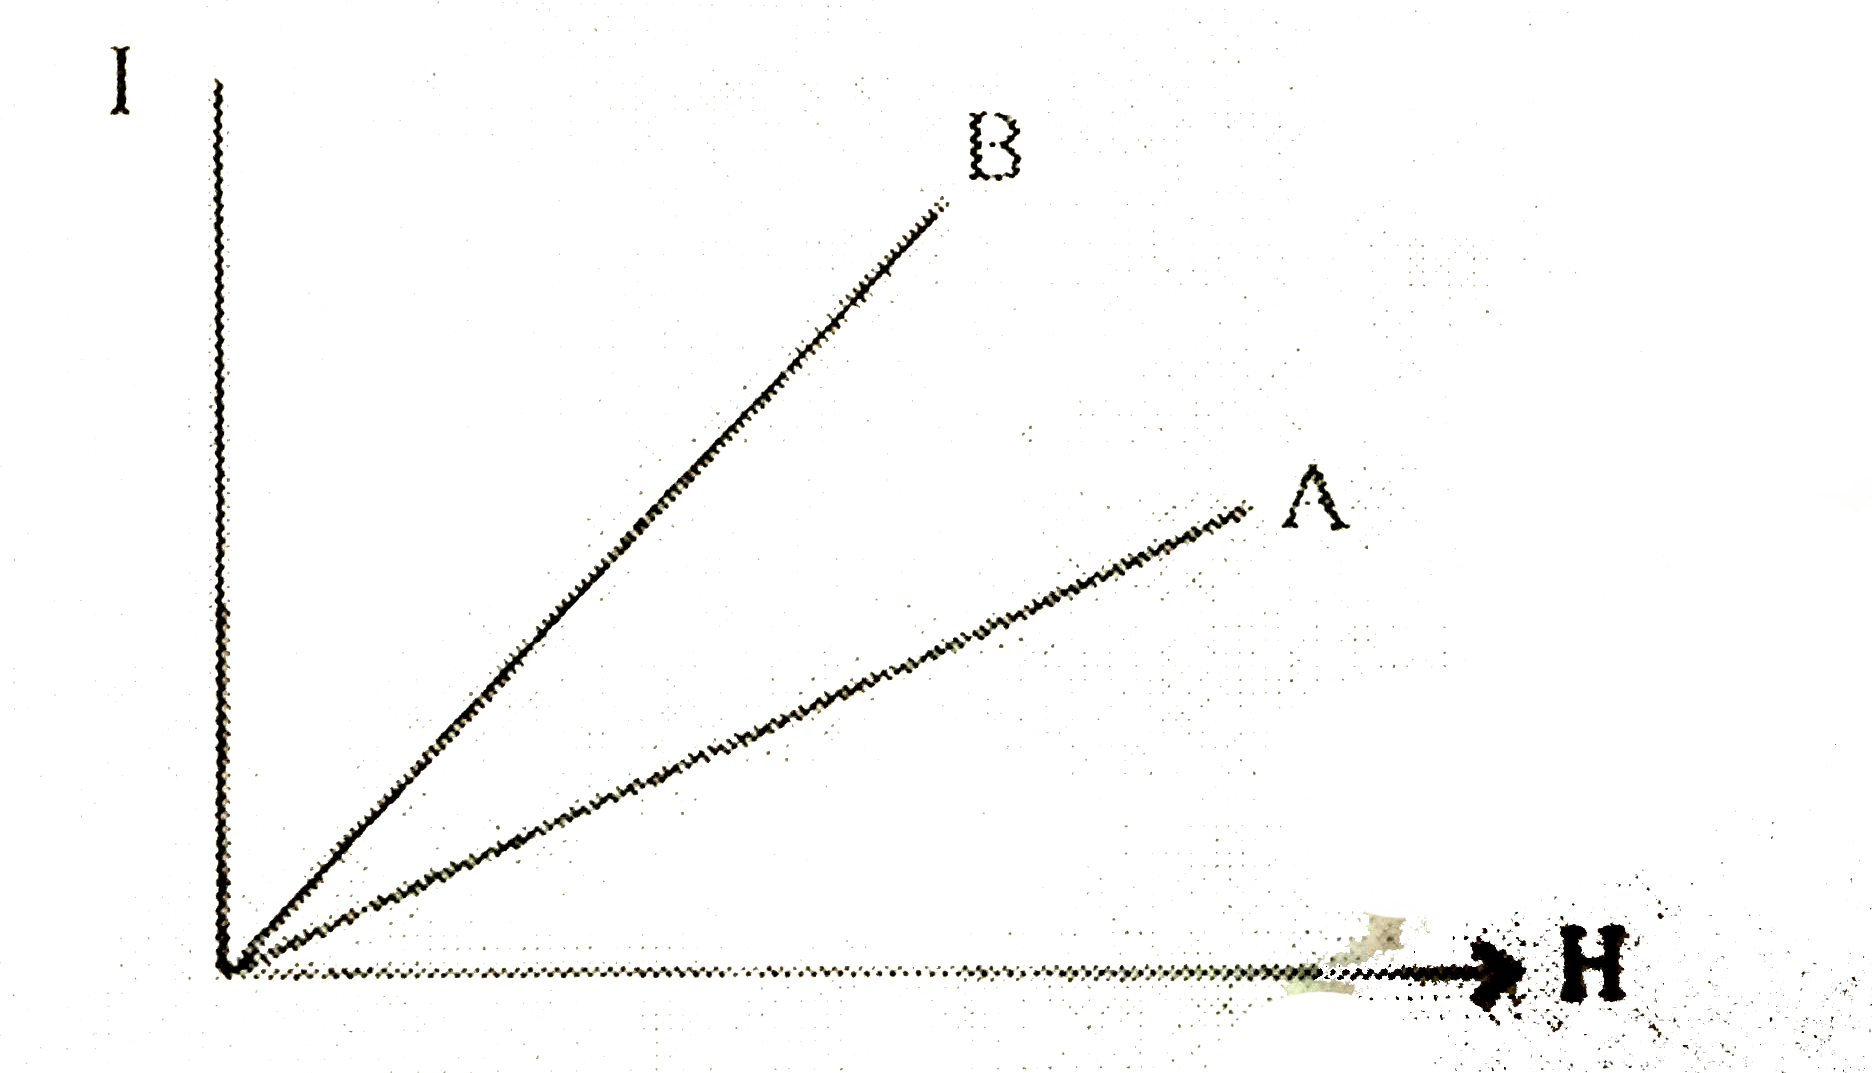
The given graphs show the variation of intensity of magnetization I with strength of applied magnetic field H for two magnetic materials P and Q.

(i) Identify the materials P and Q.
(ii) For material P,plot the varition of intensity of magnetisation with temperature. Justify your answer.
(i) P - Paramagnetic
(ii) Q-Ferromagnetic materials

In paramagnetic materials, I decreases with temperature as , I∝HT, where H is the magnetising field.
Topper's Solved these Questions
- MAGNETISM & MATTER BOOK - OSWAAL PUBLICATIONCHAPTER - MAGNETISM & MATTER EXERCISE - TOPIC-2 Magnetism ( Short Answer Type questions-II)
3 Videos
- MAGNETISM & MATTER BOOK - OSWAAL PUBLICATIONCHAPTER - MAGNETISM & MATTER EXERCISE - TOPIC-2 Magnetism (Very Short Answer Type questions)
7 Videos
- KARNATAKA II PUC APRIL 2020 CLASS -XIIBOOK - OSWAAL PUBLICATIONCHAPTER - KARNATAKA II PUC APRIL 2020 CLASS -XIIEXERCISE - PART-D (Answer any three of the following questions:)
5 Videos
- MOVING CHARGES & MAGNETISMBOOK - OSWAAL PUBLICATIONCHAPTER - MOVING CHARGES & MAGNETISMEXERCISE - TOPIC-3 (Current Carrying Conductor & Galvanometer) (Numerical Problem)
1 Videos
Similar Questions
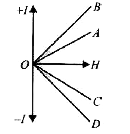
The intensity of magnetization of the magnetic fields graph for a diamagnetic material is best represented by.
View SolutionThe following figure shows the variation of intensity of magnetisation versus the applied magnetic field intensity, H, for two magnetic materials A and B :
(a) Identify the materials A and B.
(b) Why does the material B, have a larger susceptibility than A, for a given field at constant temperature?

View Solution
Knowledge Check
The variation of the intensity of magnetization (I) with respect to the magnetizing field (H) in a diamagnetic substance is described by the .
 AODBOCCOBDOA
The variation of the intensity of magnetisation (I) with respect to the magnetising field (H) in a diamagnetic substance is described by the graph
 AODBOCCOBDOA
The variation of intensity of magnctization (I) with respect to the magnetising field (H) in a diamagnetic substance is described by the graph
 AODBOCCOBDOA
The following figure shows the variation of intensity of magnetisation versus the applied magnetic field intensity, H, for two magnetic materials A and B :
(a) Identify the materials A and B.
(b) Why does the material B, have a larger susceptibility than A, for a given field at constant temperature?

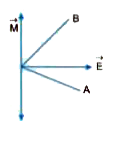
View SolutionFigure shows the variation of intensity of magnetisation →M versus the applied magnetic field intensity →H for two materials A and B:
(a) Identify the materials A and B.
(b) Why does the material B, have a larger susceptibility than A for a given field at constant temperature ?

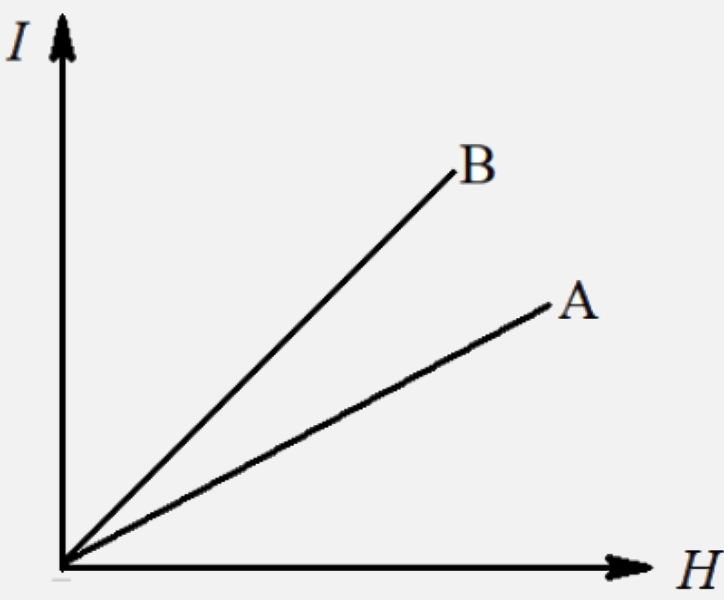
View SolutionThe following figure shows the variation of intensity of magnetisation I versus the applied magnetic field intensity H, for two magnetic materials A and B

Which of the material have a larger susceptibility for a given field at constant temperature?
View SolutionThe following figure shows the variation of intensity of magnetisation I versus the applied magnetic field intensity H, for two magnetic materials A and B

Which of the material have a larger susceptibility for a given field at constant temperature?
View SolutionThe ratio of magnetisation I to the magnetic field intensity H is
View Solution
