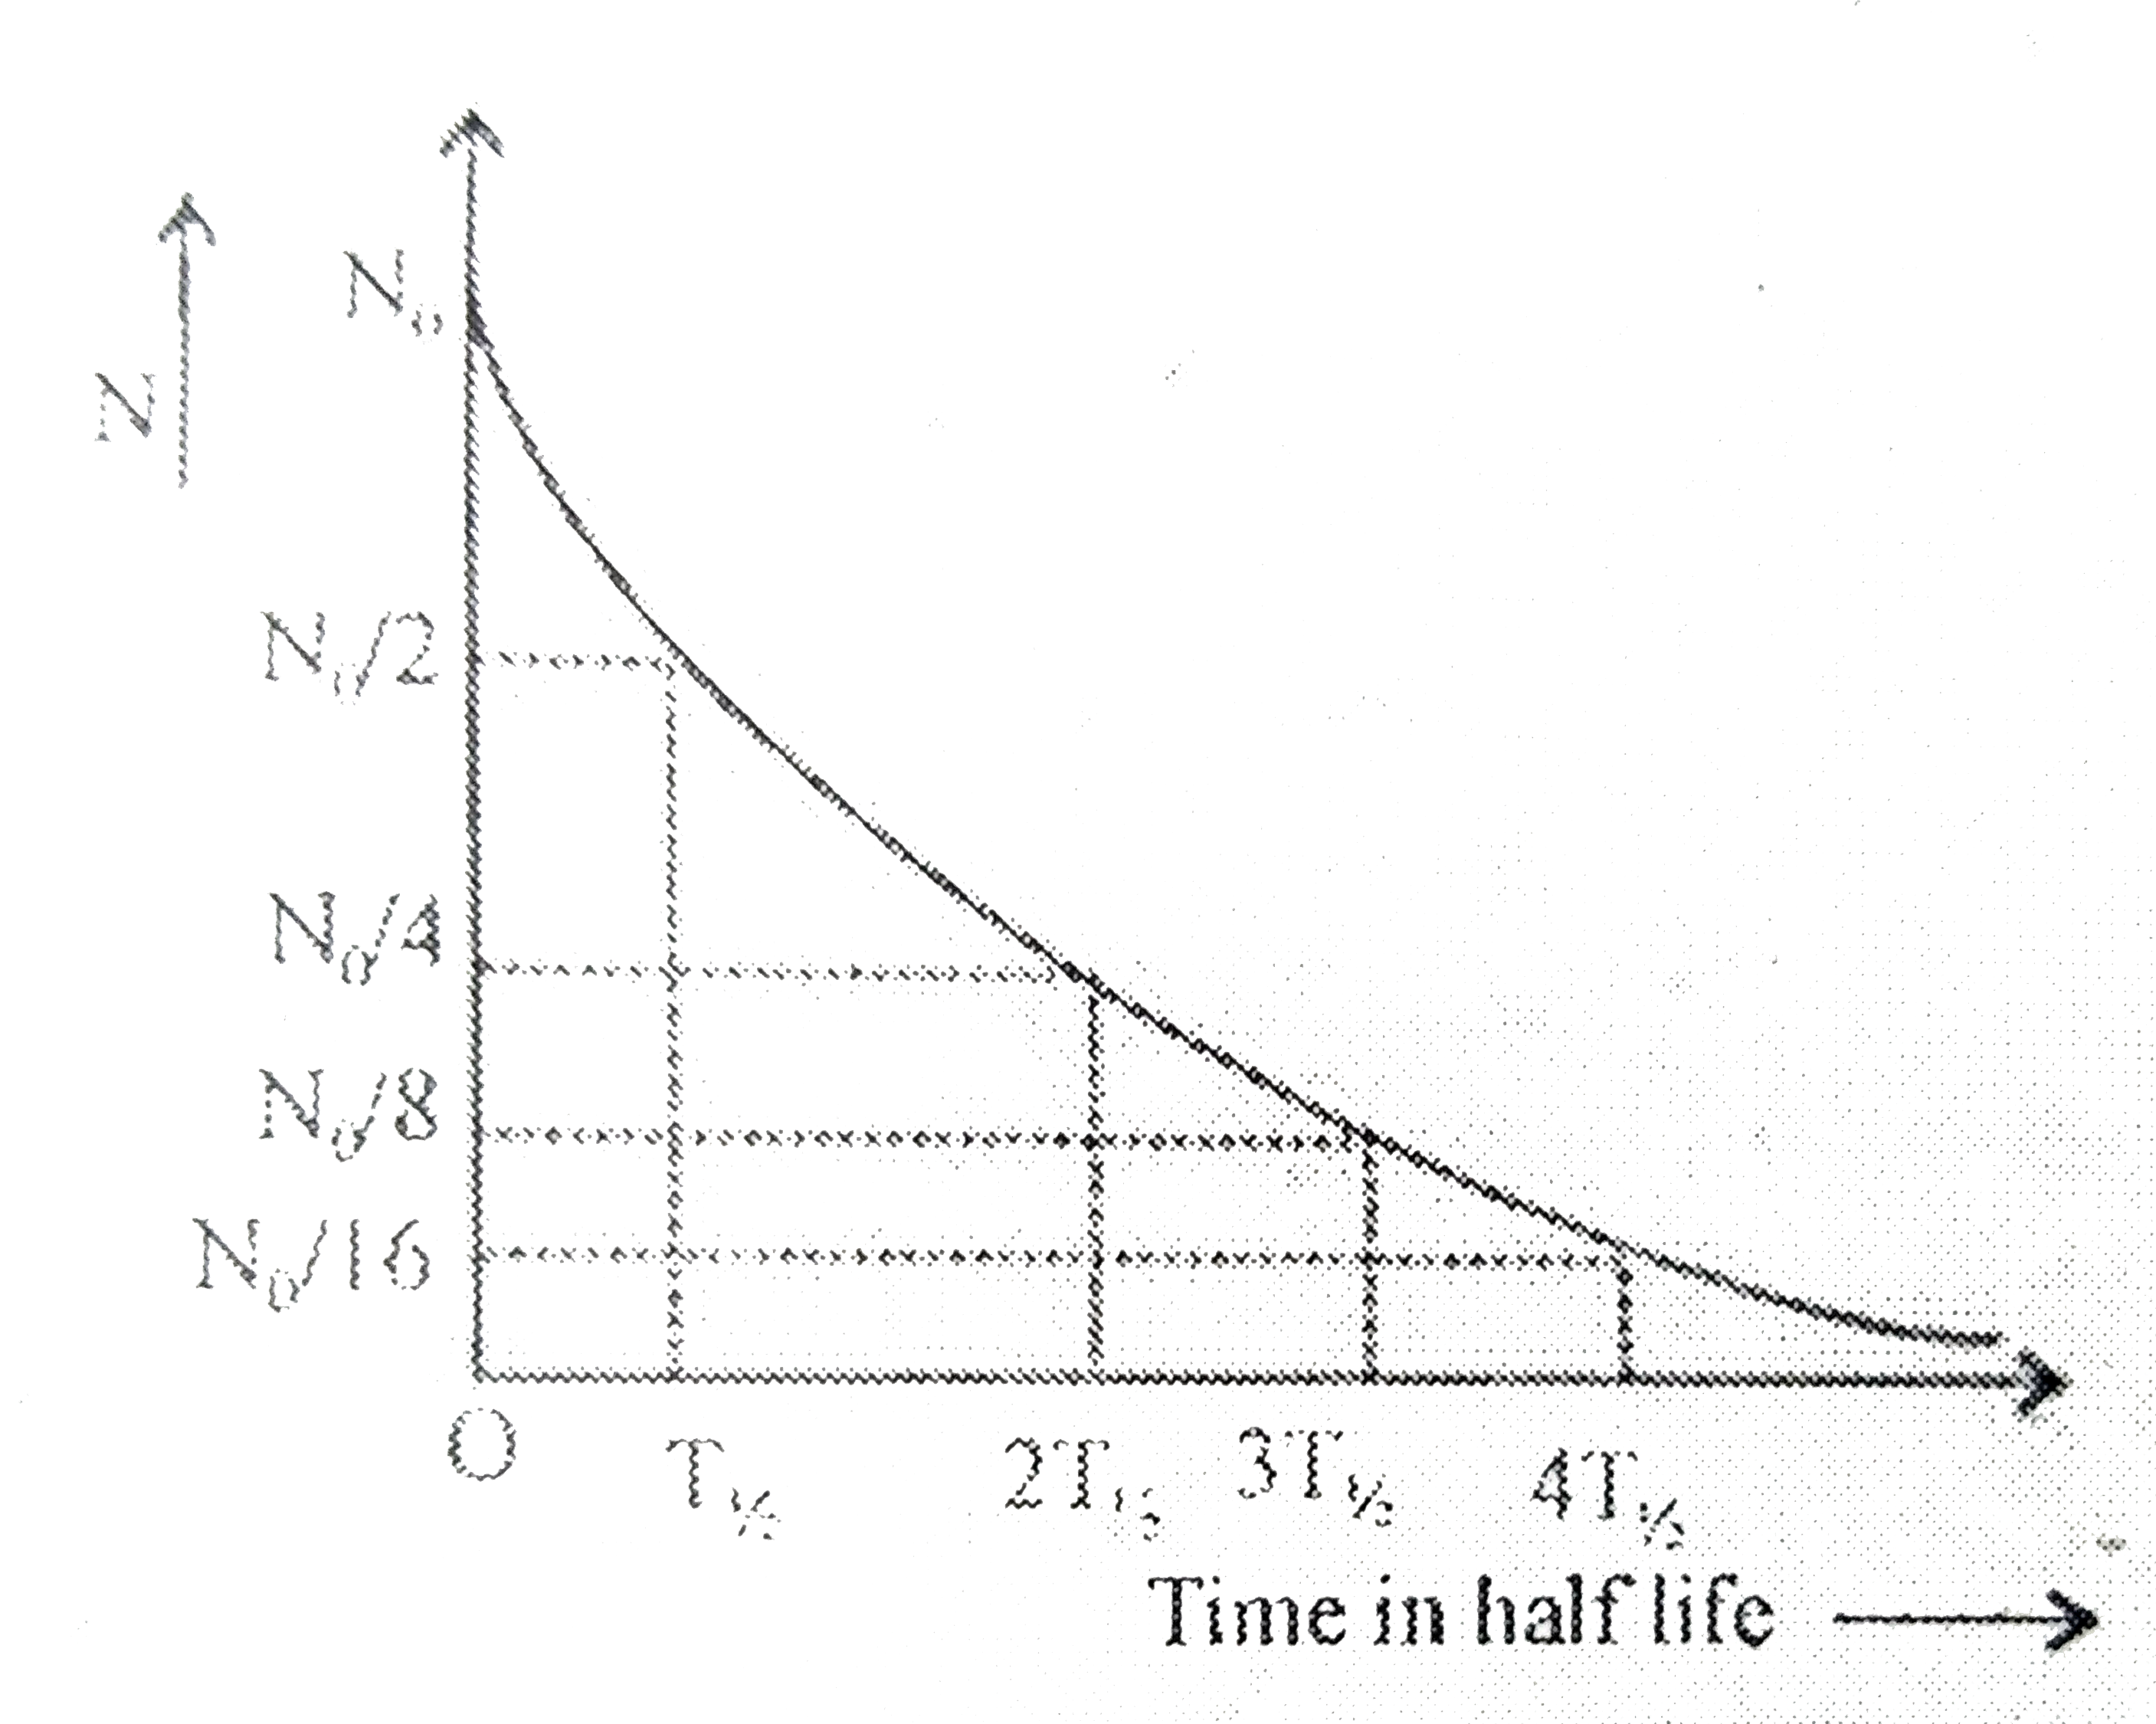
State the law of radioactive decay. Plot a graph showing the number (N) of undecayed nuclei as a function of time (t) for a given radioactive sample having half life T1/2
Depict in the plot the number of undecayed nuclei at
(i) t=3T1/2 and (ii) t=5T1/2.
Radioactive Decay Law : The number of atoms disintegrated per second at any instant is directly proportional to the number opf radioactive atoms actually present at that time.
The following graph showing the number (N) of undecayed nuclei as a function of time (t) for a given radioactive sample having half life and undecayed nuclei at (i) t=2T1/2
(ii) t=4T1/2 included also.
Topper's Solved these Questions
- BOOK - XII BOARDS PREVIOUS YEARCHAPTER - XII BOARDSEXERCISE - SET-II, DELHI BOARD8videos
XII BOARDS
- BOOK - XII BOARDS PREVIOUS YEARCHAPTER - XII BOARDSEXERCISE - SET-III, DELHI BOARD8videos
XII BOARDS
- BOOK - XII BOARDS PREVIOUS YEARCHAPTER - XII BOARDSEXERCISE - SET -III6videos
XII BOARDS
- BOOK - XII BOARDS PREVIOUS YEARCHAPTER - SAMPLE PAPER 2019EXERCISE - SECTION D6videos
SAMPLE PAPER 2019
Similar Questions
Plot a graph showing the variation of undecayed nuclei N versus time t. From the graph, find out how one can determine the half-life and average life of the radioactive nuclei.
View SolutionAt time t=0 , number of nuclei of a radioactive substance are 100. At t=1 s these numbers become 90. Find the number of nuclei at t=2s.
View Solution
Knowledge Check
- Question 1 - Select One
The decay constant of a radioactive sample is λ. Its half -life is T1/2 and mean life is T.
AT1/2=1λ,T=In2λBT1/2=In2λ,T=1λCT1/2=λin2,T=1λDT1/2=λIn2,T=In2λ - Question 2 - Select One
The graph between number of decayed atoms N' of a radioactive element and time t is.
A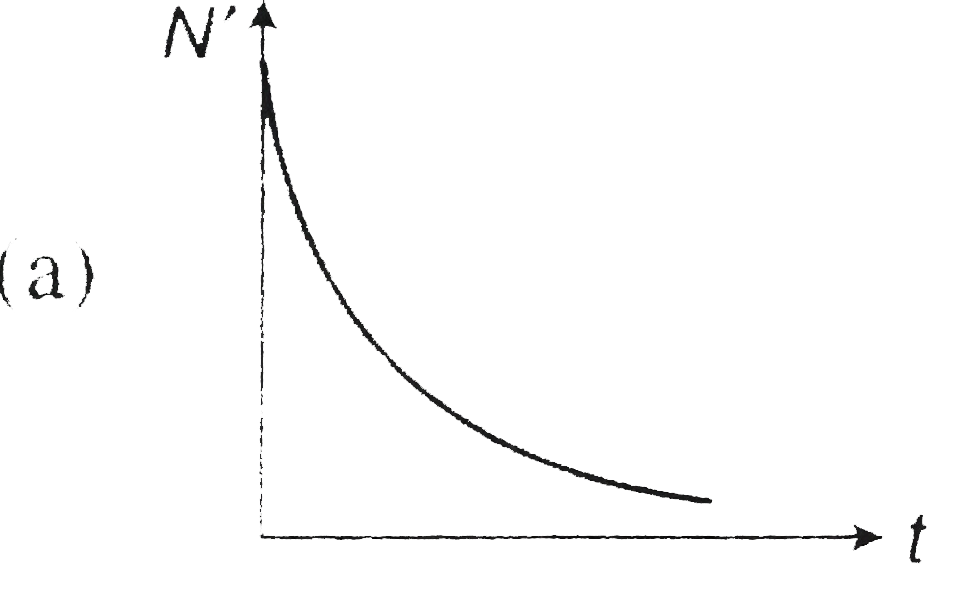 .B
.B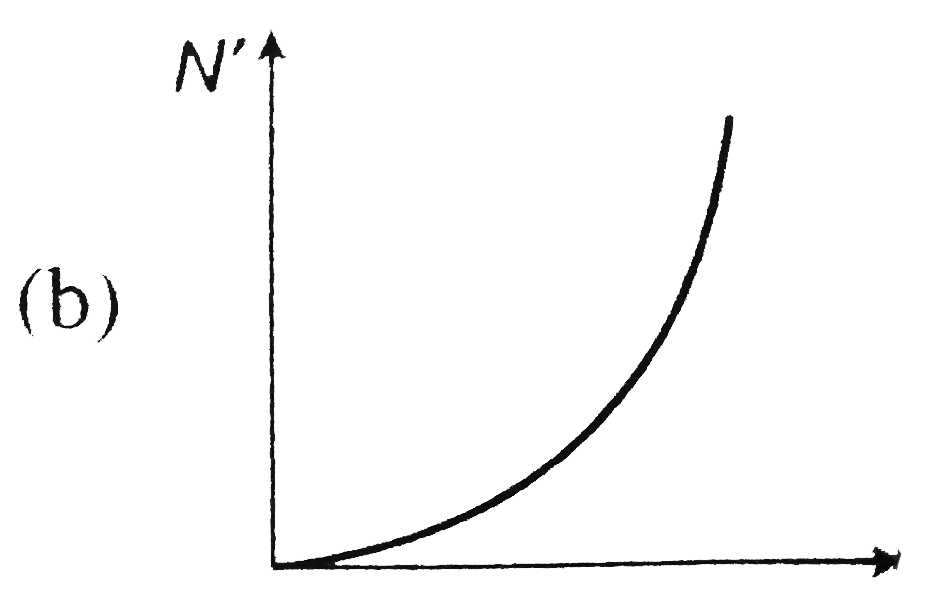 .C
.C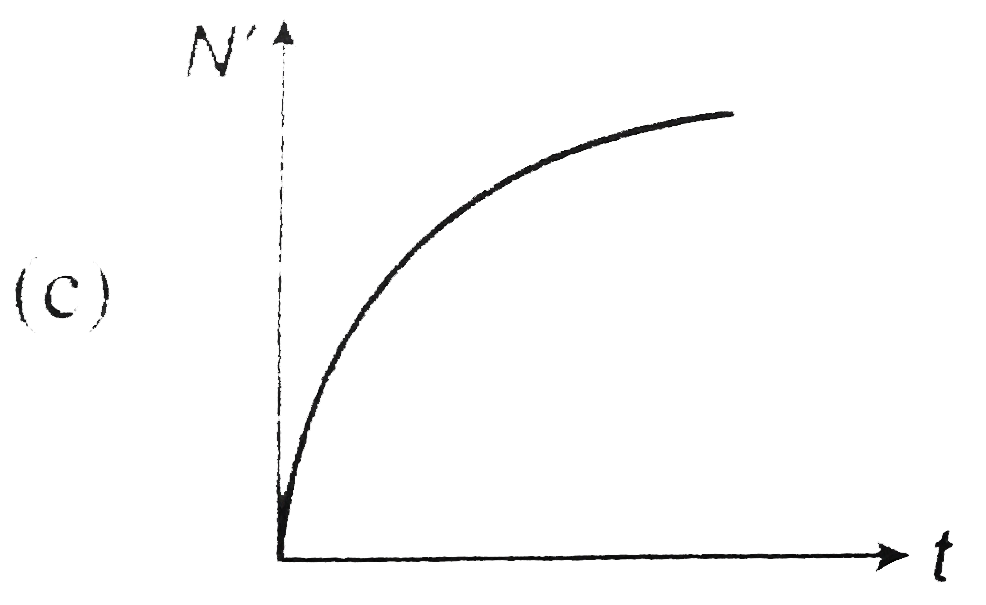 .D
.D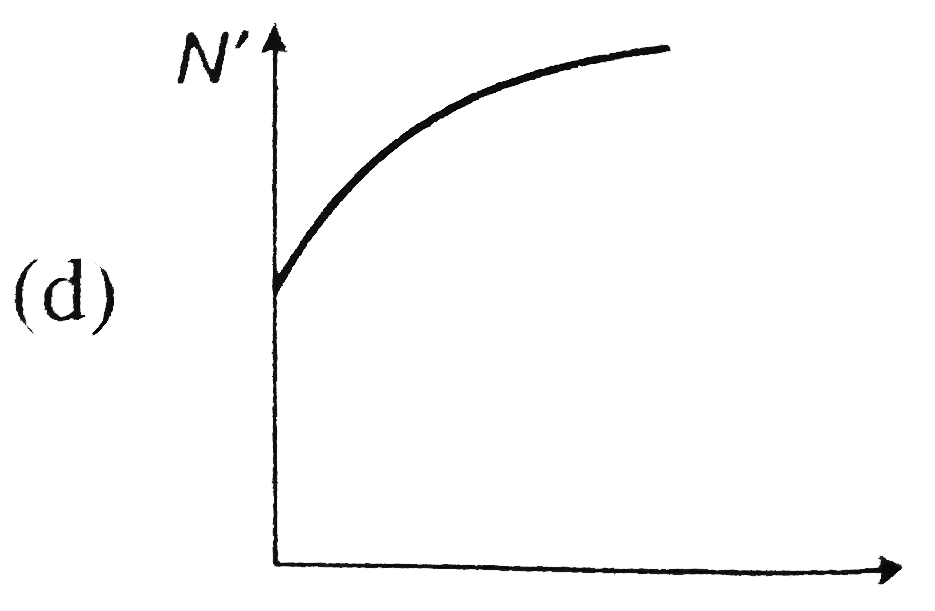 .
. - Question 3 - Select One
The rate of decay of a radioactive sampel is given by R1 at time t1 and R2 at a later time. t2. The mean life of this radioactive sample is:
AT=R1R2×t2t1BT=t1−t2In(R2/R1)CT=t2−t1In(R2/R1)DT=In(R2/R1)t1−t2
At a given instant there are 25% undecayed radioactive nuclei in a sample . After 10 sec the number of undecayed nuclei remains 12.5% Calculate :
(i) mean - life of the nuclei and
(ii) The time in which the number of undecayed nuclears will further reduce to 6.25% of the reduced number.View SolutionThe rate of decay of a radioactive sample is R1 at time t1 and R2 at time t2. Calculate the mean liffe of sample.
View SolutionA radioactive substance has half-life T12 and number of radioactive nuclides present initially was N0. What is the number of radioactive nuclides at time t ?
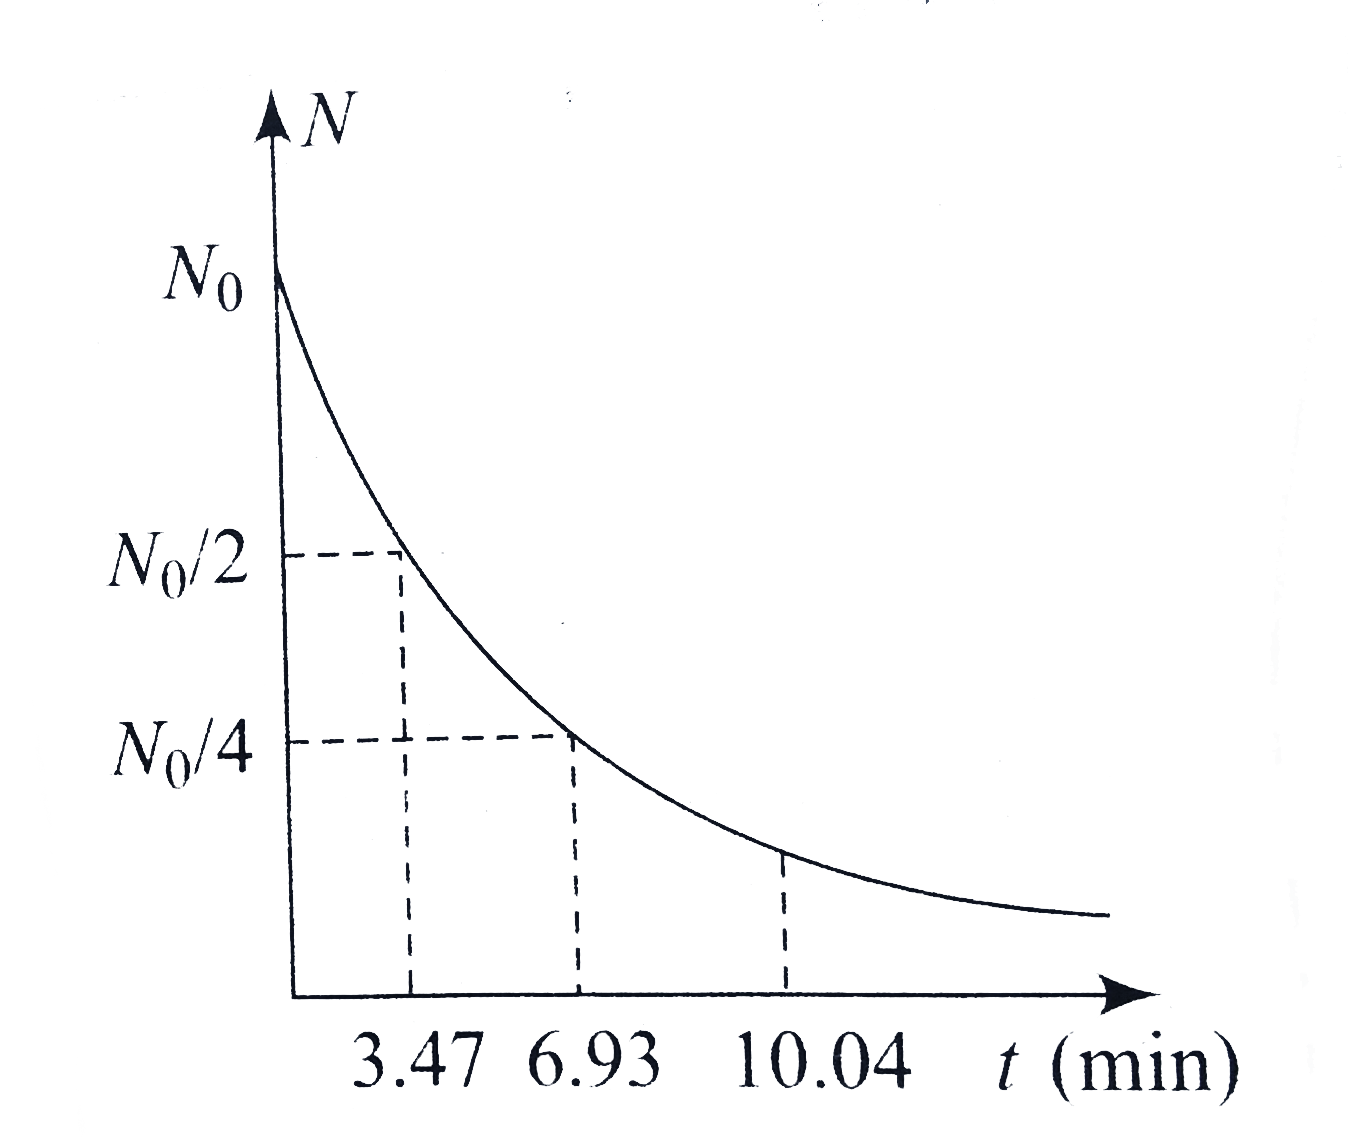
View SolutionA radioactive sample undergoes decay as per the following gragp. At timet=0, the number of undecayed nuclei is N0. Calculate the number of nuclei left after 1h.
 .View Solution
A radioactive sample remains undecayed 916 after time t.How much sample remains undecayed after time t2
View Solution
