Plot a graph showing the variation of undecayed nuclei N versus time t. From the graph, find out how one can determine the half-life and average life of the radioactive nuclei.
A graph showing the variation of undecayed nuclei N versus time ft has been plotted here.

Let at time t=0, the number of nuclei be N0. Then time corresponding to N=N02 will give us the value of half-life period T12 of given radioactive nuclei.
Now average life of the nuclei
τ=T120.6931=1.44T12
Topper's Solved these Questions
- NUCLEIBOOK - U-LIKE SERIESCHAPTER - NUCLEIEXERCISE - Long Answer Question-I
22 Videos
- NUCLEIBOOK - U-LIKE SERIESCHAPTER - NUCLEIEXERCISE - Long Answer Question-II
2 Videos
- NUCLEIBOOK - U-LIKE SERIESCHAPTER - NUCLEIEXERCISE - Very Short Answer Question
30 Videos
- MOVING CHARGES AND MAGNETISM BOOK - U-LIKE SERIESCHAPTER - MOVING CHARGES AND MAGNETISM EXERCISE - SELF ASSESSMENT TEST (SECTION D)
1 Videos
- RAY OPTICS AND OPTICAL INSTRUMENTSBOOK - U-LIKE SERIESCHAPTER - RAY OPTICS AND OPTICAL INSTRUMENTSEXERCISE - SELF ASSESSMENT TEST (SECTION B)
3 Videos
Similar Questions
Knowledge Check
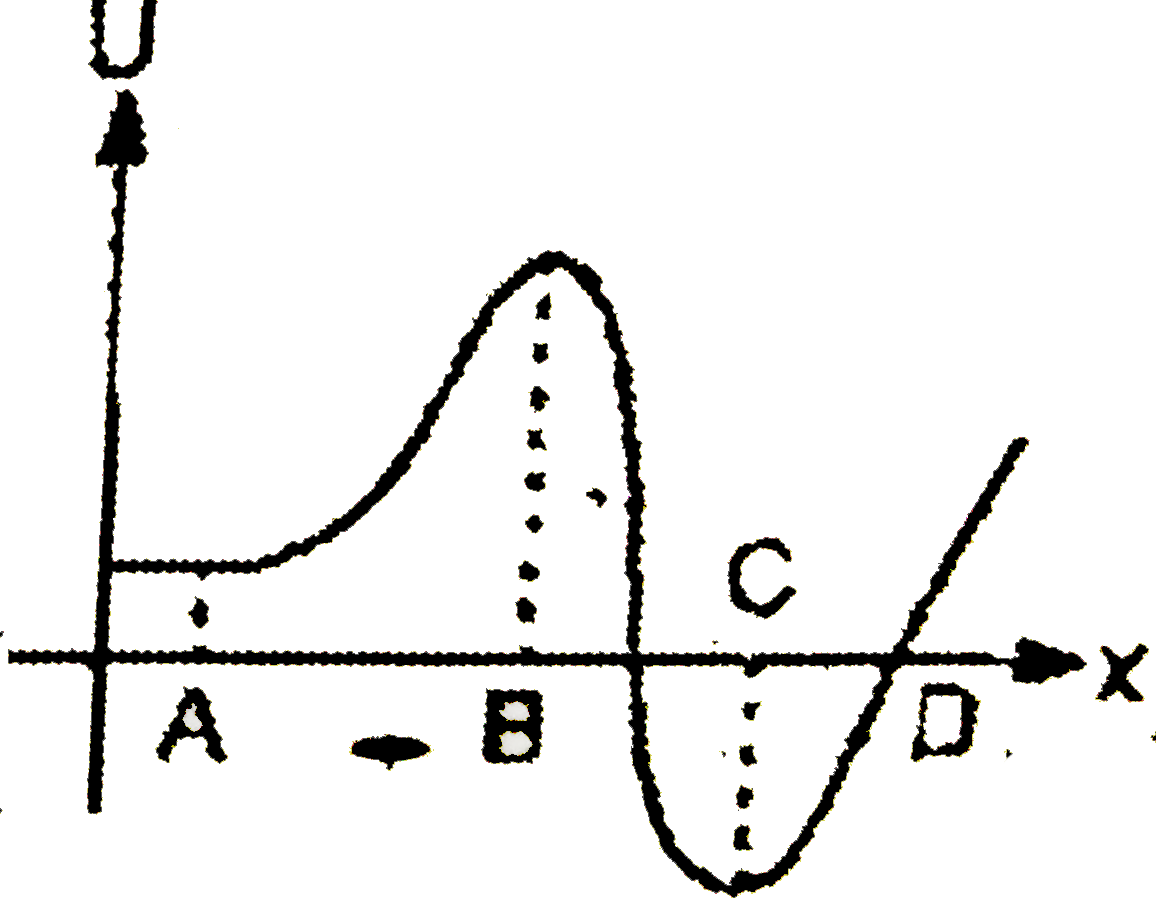
The following plot shows the variation of potential energy (U) of a system versus position (x). From the graph we can interpret that :
 APoint D is position of neutral equilibriumBPoint B is position of unstable equilibriumCPoint C is position of stable equilibriumDPoint A is position of neutral equilibrium
State the law of radioactive decay.
Plot a graph showing the number (N) of undecayed nuclei as a function of time (t) for a given radioactive sample having half-life T12.
Depict in the plot the number of undecayed nuclei at (i) t=T12 and (ii) t=5T12.
View SolutionState the law of radioactive decay. Plot a graph showing the number (N) of undecayed nuclei as a function of time (t) for a given radioactive sample having half life T1/2
Depict in the plot the number of undecayed nuclei at
(i) t=3T1/2 and (ii) t=5T1/2.
View SolutionState the law of radioactive decay. Plot a graph showing the number (N) of undecayed nuclei as a function of time (t) for a given radioactive sample having half life T1/2
Depict in the plot the number of undecayed nuclei at
(i) t=3T1/2 and (ii) t=5T1/2.
View SolutionThe correct relation between tav=average life and t1/2= half life for a radioactive nuclei.
View SolutionThe correct relation between tav=average life and t1/2= half life for a radioactive nuclei.
View Solution(a) State the law of radioactive decay. Plot a graph showing the number (N) of undecayed nuclei as a function of time (t) for a given radioactive sample having half-life T12.
Depict in the plot the number of undecayed nucei at (i) t=3T12 and (ii) t=5T12.
(b) The half-life, of a given radioactive nuclide, is 138.6 days. What is the mean life of this nuclide? After how much time will a given sample of this radioactive nuclide get reduced to only 12.5% of its initial value?
View SolutionFrom a radioactive substance n1 nuclei decay per second at an instant when total number of nuclei are n2. Find half-life of the radioactive substance.
View Solution
