Using Bohr's postulates, obtain the expressions for (i) kinetic energy and (ii) potential energy of the electron in stationary state of hydrogen atom.
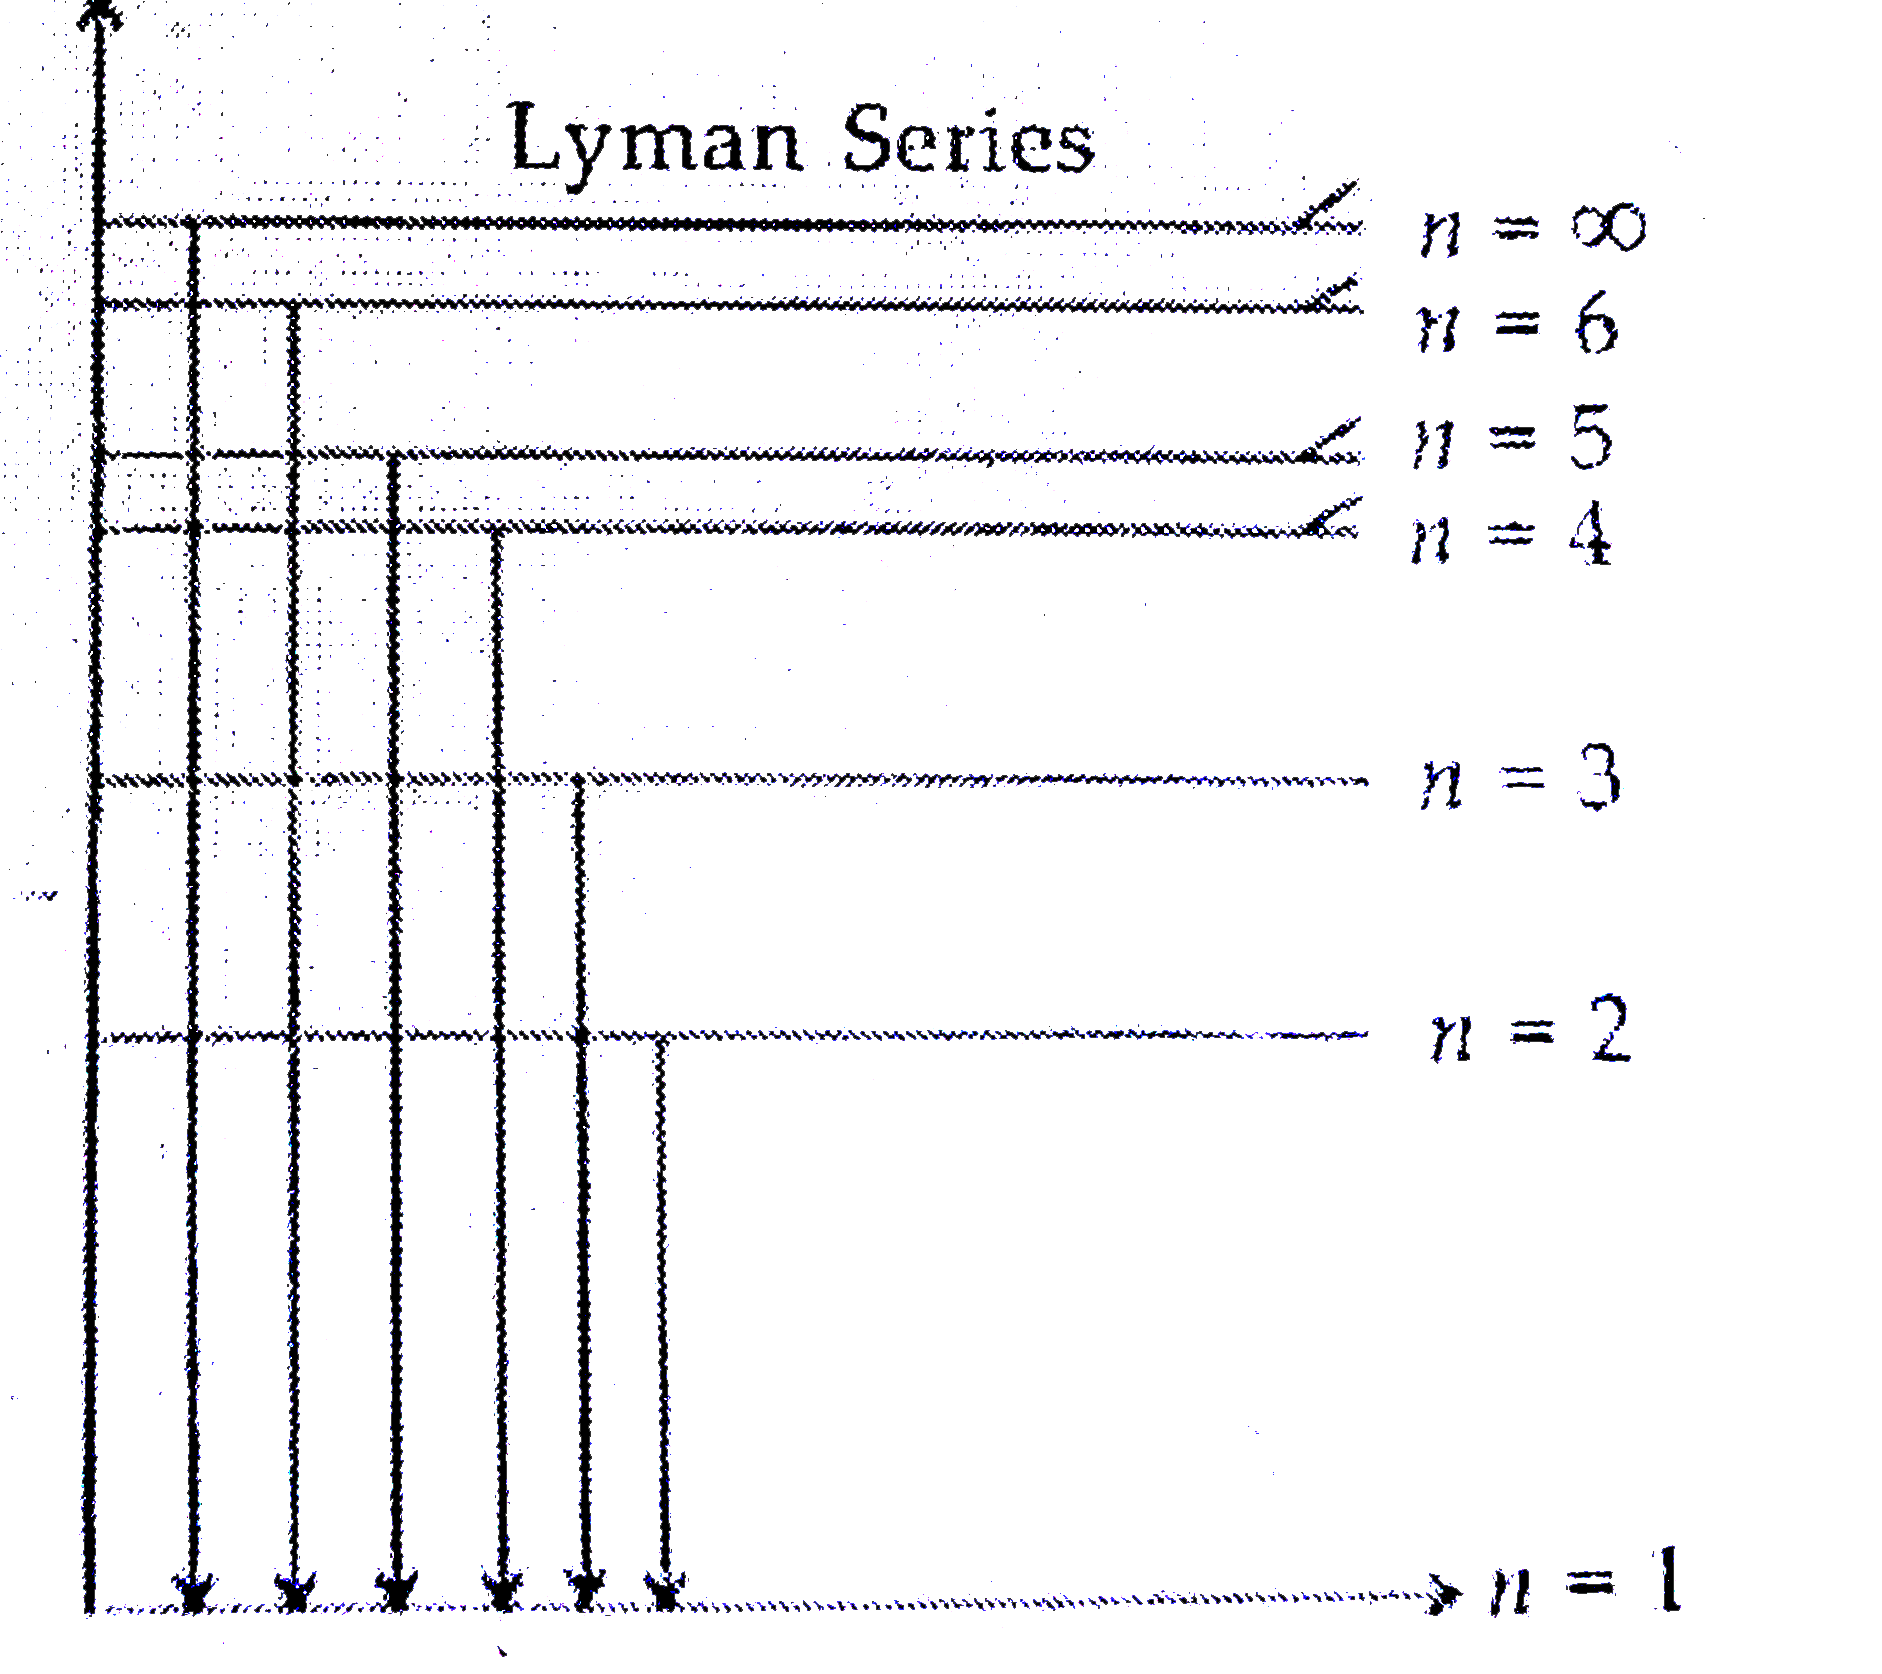
Draw the energy level diagram showing how the transitions between energy levels result in the appearance of Lymann Series.
This series is produced when electron jumps from higher orbits to the first stationary orbit (i.e., nf=1).Thus, for this series.
¯v=1λ=R(1l2−1n2i)
∴ where ni=2,3,4,5...
For the longest wavelength of Lyman Series ni=2.

Topper's Solved these Questions
- XII BOARDSBOOK - XII BOARDS PREVIOUS YEARCHAPTER - XII BOARDSEXERCISE - SET - III (Delhi Board)
8 Videos
- XII BOARDSBOOK - XII BOARDS PREVIOUS YEARCHAPTER - XII BOARDSEXERCISE - [SET - I]
32 Videos
- XII BOARDSBOOK - XII BOARDS PREVIOUS YEARCHAPTER - XII BOARDSEXERCISE - SET - I
30 Videos
- SAMPLE PAPER 2019BOOK - XII BOARDS PREVIOUS YEARCHAPTER - SAMPLE PAPER 2019EXERCISE - SECTION D
6 Videos
Similar Questions
Draw energy level diagram for Balmer series for transition between eriergy levels.
View SolutionUsing Bohr's postulates, obtain the expression for the total energy of the electron in the stationary states of the hydrogen atom. Hence draw the energy level diagram showing how the line spectra corresponding to Balmer series occur due to transition between energy levels.
View Solution
Knowledge Check
The ratio of kinetic energy and potential energy of an electron in a Bohr of a hydrogen -like species is
A1/2B−1/2C1D−1The ratio of kinetic energy to the total energy of an electron in a Bohr orbit of the hydrogen atom, is
A2:−1B1:−1C1:−1D1−2The ratio of kinetic energy to the total energy of an electron in a Bohr orbit of the hydrogen atom, is
A1:−2B1:1C2:−1D1:−1
Using Bohr's postulates, obtain the expression for the total energy of the electron in the stationary states of the hydrogen atom. Hence draw the energy level diagram showing how the line spectra corresponding to Balmer series occur due to transiton between energy levels.
View SolutionUsing Bohr's postulates , obtain the expreesion for the total energy in the stationary states of hydrogen atom . Hence , draw the energy level diagram showing how the line spectra corresponding to Balmer series occur due to transition between energy levels.
View SolutionThe ratio of kinetic energy to the total energy of an electron in a Bohr orbit of the hydrogen atom, is
View SolutionThe ratio of kinetic energy to the total energy of an electron in a Bohr orbit of the hydrogen atom, is
View SolutionDraw a neat, labelled energy level diagram for H atom showing the transitions.
Explain the series of spectral lines for H atom. Whose fixed inner orbit numbers are 3 and 4 respectively.
The work function for potassium and caesiumare 2.25 eV and 2.14 eV respectively. Is the photoelectric effect possible for either of them if incident wavelength is 5180 Å ?
[Given : Planck's constant =6.63×10⁻³⁴J.s., Velocity of light =3×10⁸m/s,1eV=1.6×10−19J]
View Solution
