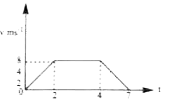
Figure given here shows the variation of velocity of a particle with time.

Find the following:
(i) Displacement during the time intervals.
(a) 0 to 2 sec., (b) 2 to 4 sec. and (c) 4 to 7 sec
(ii) Accelerations at
(a)t = 1 sec, (b) t = 3 sec. and (c)t = 6 sec.
(iii) Average acceleration
(a) between t = 0 to t = 4 sec.
(b) between t = 0 to t = 7 sec.
(iv) Average velocity during the motion.
Text Solution
(i)displacement =Area enclosed between
v-t graph and time axis.
(ii) Acceleration = slope of v-t curve
(iii) Average acceleration=Total change in velocityTotal time
(iv) Average velocity =Total displacement Total time
|
Topper's Solved these Questions
- MOTION IN A STRAIGHT LINE BOOK - AAKASH SERIESCHAPTER - MOTION IN A STRAIGHT LINE EXERCISE - EXERCISE -I
58 Videos
- MOTION IN A STRAIGHT LINE BOOK - AAKASH SERIESCHAPTER - MOTION IN A STRAIGHT LINE EXERCISE - EXERCISE -II
80 Videos
- MOTION IN A PLANEBOOK - AAKASH SERIESCHAPTER - MOTION IN A PLANEEXERCISE - QUESTION FOR DESCRIPTIVE ANSWER
7 Videos
- MOVING CHARGES AND MAGNETISMBOOK - AAKASH SERIESCHAPTER - MOVING CHARGES AND MAGNETISMEXERCISE - EXERCISE-III
45 Videos
Similar Questions
Knowledge Check
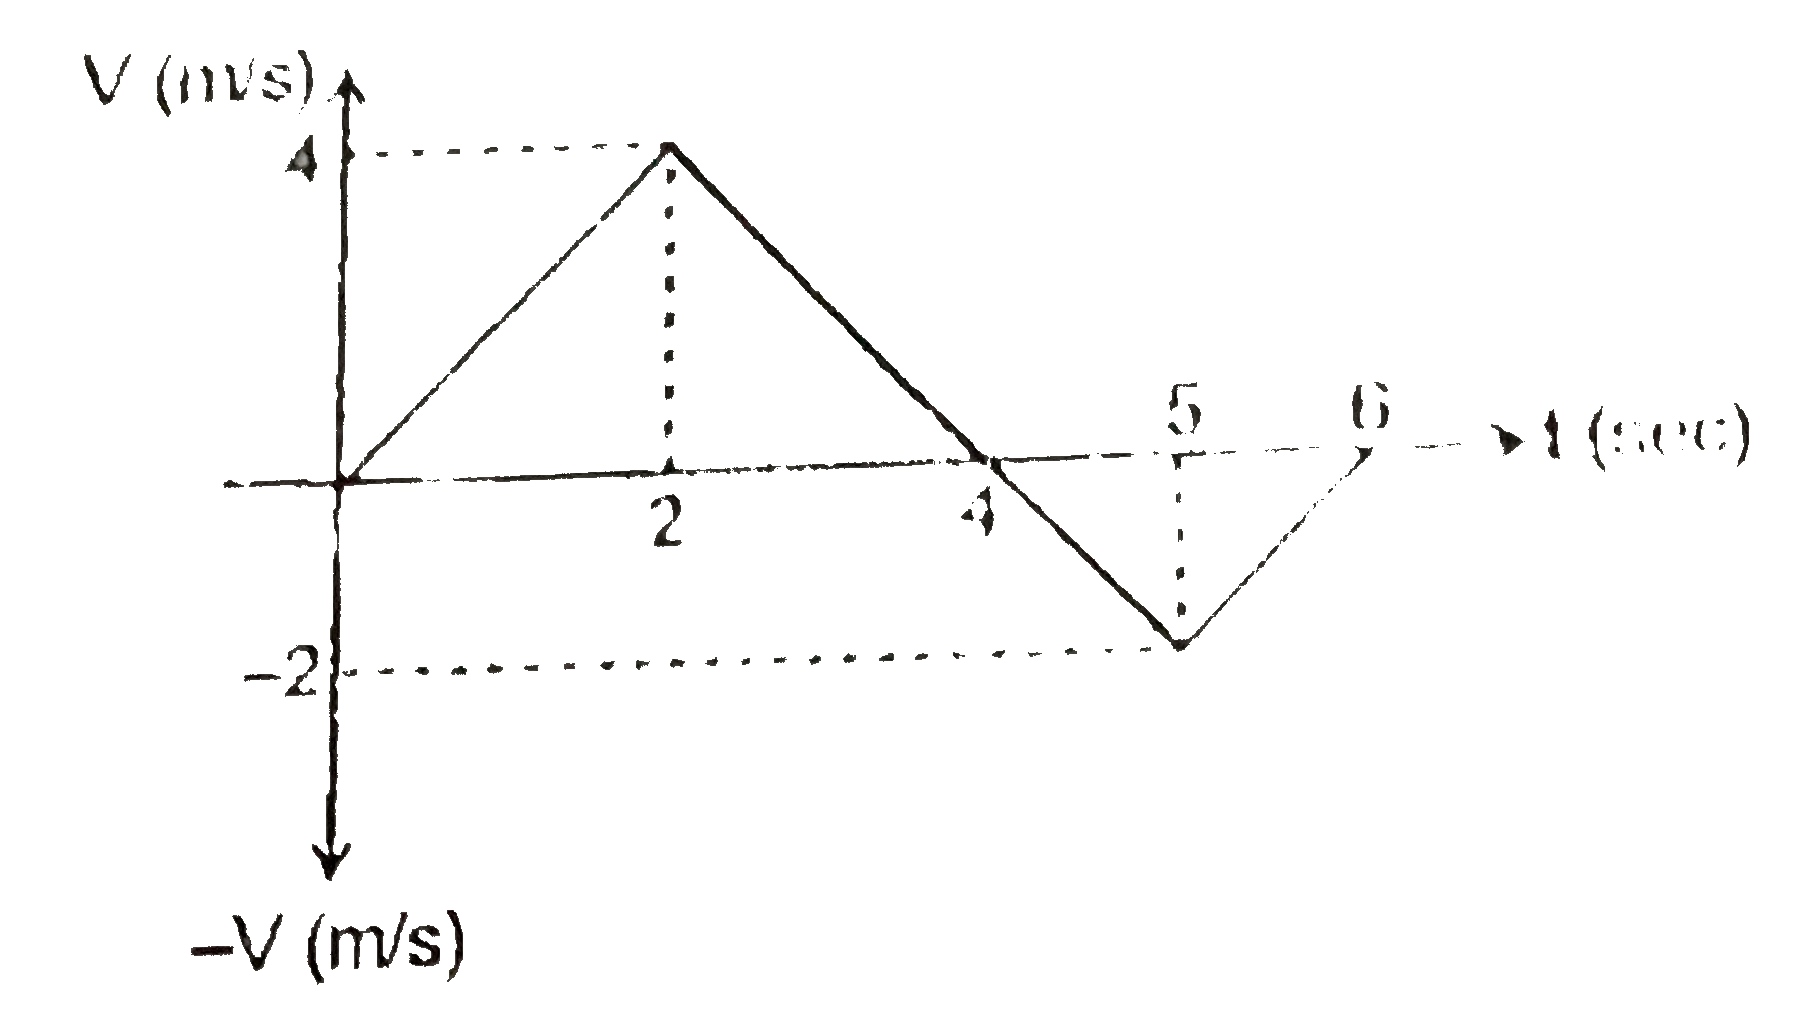
During one dimensional motion on x-axis Velocity time graph for particle is given.

Find total displacement during (t = 0 sec) to (t = 6 sec)A6 mB10 mC8 mD2 mDuring one dimensional motion on x-axis Velocity time graph for particle is given.

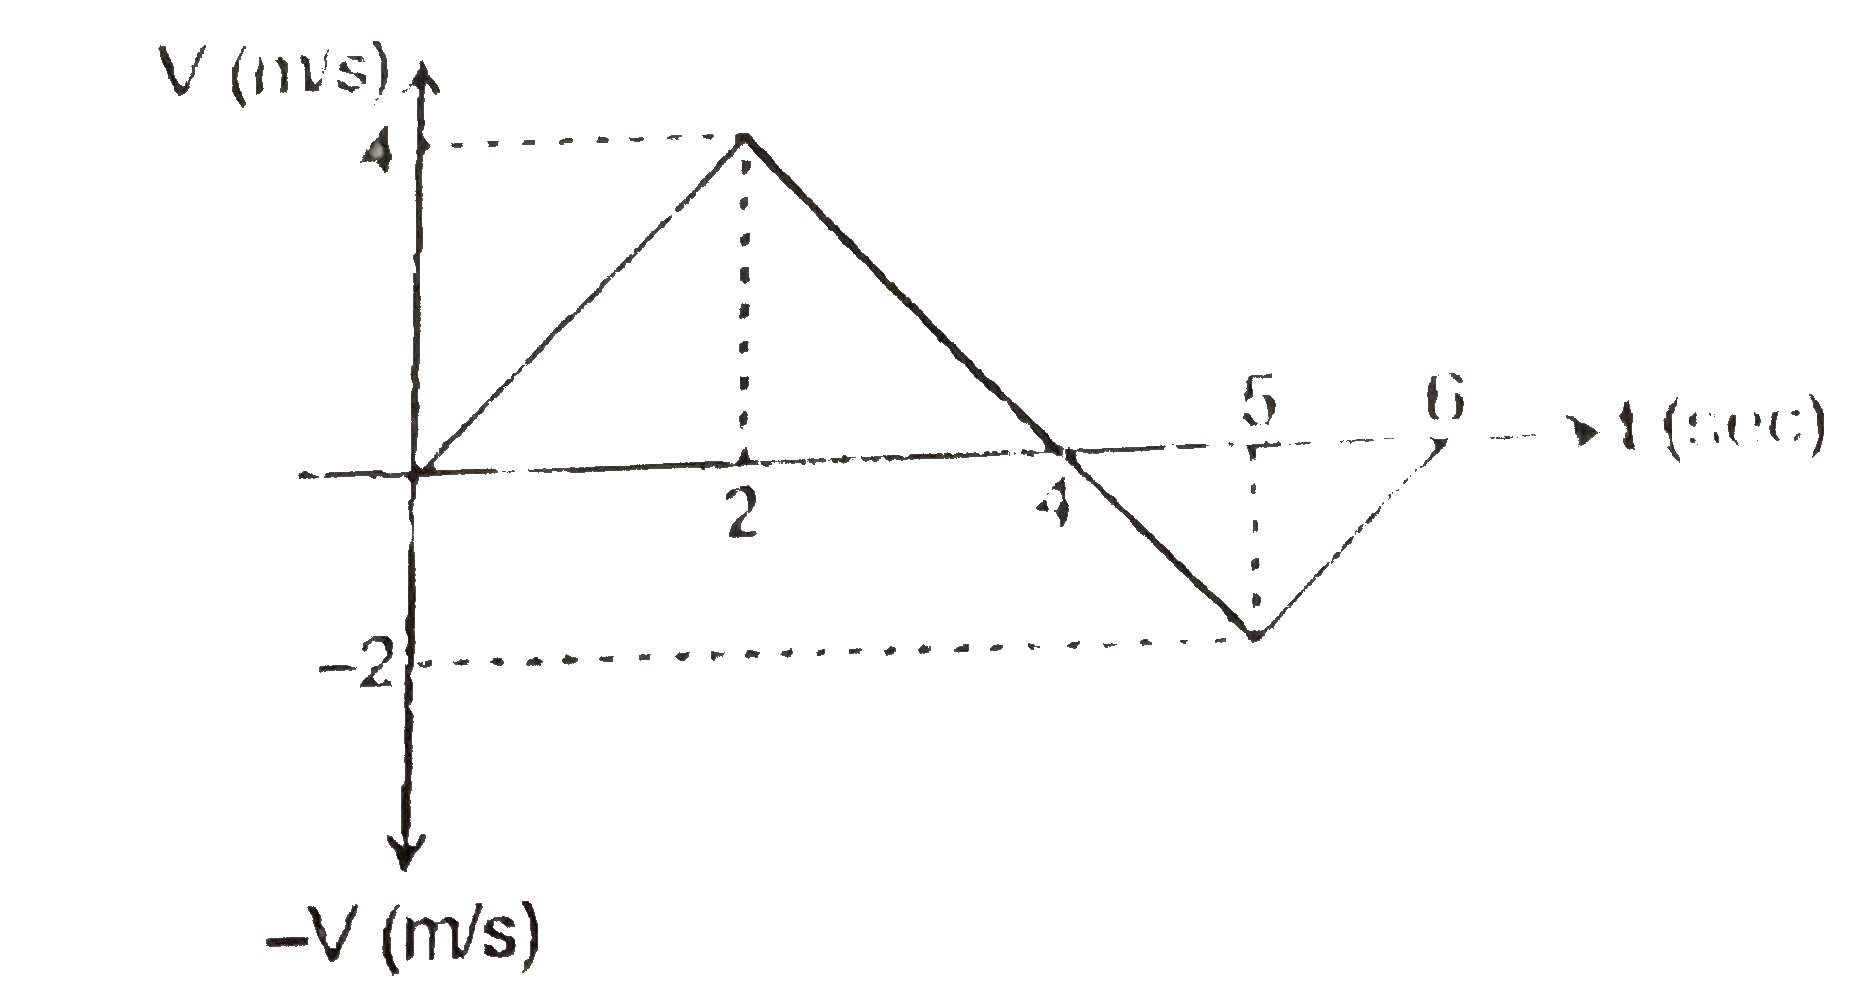
Average acceleration between (t = 0 sec) to (t = 6 sec)A53m/s2B12m/s2C1m/s2DzeroIn the above example, the average acceleration of the particle in the interval t = 1 to t = 3 sec will be-
A12 a – 2bB2b – 12 aC2a – 12bD12b – 2a
Velocity of a particle varies with time as v=4t. Calculate the displacement of particle between t=2 to t=4 sec.
View SolutionVelocity of a particle varies with time as v=4t. Calculate the displacement of particle between t=2 to t=4 sec.
View SolutionThe position vector of a moving particle at't' sec is given by →r=3ˆi+4t2ˆj−t3ˆk . Its displacement during an interval of t = Is to 3 sec is
View SolutionFind the distance covered by a body in a free fall within the time interval t = a sec to t = b sec
View SolutionDuring one dimensional motion on x-axis Velocity time graph for particle is given.

Find total distance during (t = 0 sec) to (t = 6 sec)
View Solution
