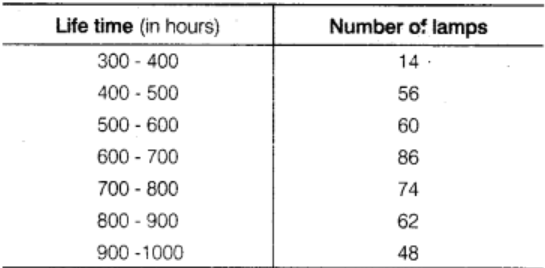
The following table gives the distribution of the life time of 400 neon lamps: Lite time: (in hours) Number of lamps 1500−2000 14 2000-2500 56 2500-3000 60 3000-3500 86 3500-4000 74 4000-4500 62 4500-5000 48 Find the median life.
Median class = 3000−3500
l=3000
h=500
cf=130
f=86
Median=l+(n2)−cf86⋅500
=3000+200−13086⋅500
=3406.98hours
Topper's Solved these Questions
- STATISTICSBOOK - NCERT ENGLISHCHAPTER - STATISTICSEXERCISE - EXERCISE 14.2
6 Videos
- STATISTICSBOOK - NCERT ENGLISHCHAPTER - STATISTICSEXERCISE - EXERCISE 14.1
9 Videos
- STATISTICSBOOK - NCERT ENGLISHCHAPTER - STATISTICSEXERCISE - EXERCISE 14.4
3 Videos
- SOME APPLICATIONS OF TRIGONOMETRYBOOK - NCERT ENGLISHCHAPTER - SOME APPLICATIONS OF TRIGONOMETRYEXERCISE - SOLVED EXAMPLES
7 Videos
- SURFACE AREAS AND VOLUMESBOOK - NCERT ENGLISHCHAPTER - SURFACE AREAS AND VOLUMESEXERCISE - Exercise 13.3
9 Videos
Similar Questions
The following table gives the life times of 400 neon lamps:
(i) Represent the given information with the help of histogram.
(ii) How many lamps have a life time of more than 700 hours?

View SolutionThe following table gives the distribution of income of 100 families in a village. Calculate the standard deviation: Income Rs. 0-1000 1000-2000 2000-3000 3000-4000 4000-5000 5000-6000 No. of Families 18 26 30 12 10 4
View SolutionThe following table gives the distribution of income of 100 families in a village. Calculate the standard deviation: Income Rs., 0-1000, 1000-2000, 2000-3000, 3000-4000, 4000-5000, 5000-6000 No. of Families, 18, 26, 30, 12, 10, 4
View SolutionThe following data gives the distribution of total monthly household expenditure of 200 families of a village. Find the modal monthly expenditure of the families. Also, find the mean monthly expenditure: Expenditure (Rs.) Frequency Expenditure (Rs.) Frequency 1000-1500 24 3000-3500 30 1500-2000 40 3500-4000 22 2000-2500 33 4000-4500 16 2500-3000 28 4500-5000 7
View SolutionThe following data gives the distribution of total household expenditure (in rupees) of manual workers in a city: Expenditure (Rs.) Frequency Expenditure ( Rs.) Frequency 1000-1500 24 3000-3500 30 1500-2000 40 3500-4000 22 2000-2500 33 4000-4500 16 2500-3000 28 4500-5000 7 Find the average expenditure which is being done by the maximum number of manual workers.
View SolutionThe following table gives the life time of 400 neon lamps: Life time (in hours 300-400 400-500 500-600 600-700 700-800 800-900 900-1000 No. of lamps: 14 56 60 86 74 62 48 A bulb is selected at random. Find the probability that the life time of the selected bulb is : (i)less than 400 (ii)between 300 to 800 hours (iii)at least 700 hours.
View SolutionAt present, a firm is manufacturing 2000 items. It is estimated that the rate of change of production P w.r.t. additional number of workers x is given by dPdx=100−12√x. If the firm employs 25 more workers, then the new level of production of items is (1) 3000 (2) 3500 (3) 4500 (4) 2500
View Solution
