In Q.1, Exercise 14.2, you were asked to prepare a frequency distribution table regarding the blood groups of 30 students of a class. Use this table to determine the probability that a student of this class, selected at random, has blood group AB.
To determine the probability that a randomly selected student from the class has blood group AB, we can follow these steps:
1. Identify the Total Number of Students:
- We know that the total number of students in the class is 30.
2. Count the Number of Students with Blood Group AB:
- From the frequency distribution table, we find that the number of students with blood group AB is 3.
3. Use the Probability Formula:
- The formula for probability is given by:
Probability=Number of favorable outcomesTotal number of outcomes
- In this case, the number of favorable outcomes is the number of students with blood group AB (which is 3), and the total number of outcomes is the total number of students (which is 30).
4. Calculate the Probability:
- Substitute the values into the formula:
Probability of blood group AB=330
- Simplify the fraction:
330=110
5. Conclusion:
- Therefore, the probability that a randomly selected student has blood group AB is 110.
Final Answer:
The probability that a student of this class, selected at random, has blood group AB is 110.
---
- We know that the total number of students in the class is 30.
- From the frequency distribution table, we find that the number of students with blood group AB is 3.
- The formula for probability is given by:
Probability=Number of favorable outcomesTotal number of outcomes
- In this case, the number of favorable outcomes is the number of students with blood group AB (which is 3), and the total number of outcomes is the total number of students (which is 30).
- Substitute the values into the formula:
Probability of blood group AB=330
- Simplify the fraction:
330=110
- Therefore, the probability that a randomly selected student has blood group AB is 110.
The probability that a student of this class, selected at random, has blood group AB is 110.
Similar Questions
A study was conduced to find out the concentration of sulphur dioxide in the air in parts per million (ppm) of a certain city. The data obtained for 30 days is as follow:
0.03 0.08 0.08 0.09 0.04 0.170.16 0.05 0.02 0.06 0.18 0.200.11 0.08 0.12 0.13 0.22 0.070.08 0.01 0.10 0.06 0.09 0.180.11 0.07 0.05 0.07 0.01 0.04
You were asked to prepare a frequency distribution table, regarding the concentration of sulphur dioxide in the air in parts per million of a certain city for 30 days. Using this table, find the probability of the concentration of sulphur dioxide in the interval 0.12-0.16 on any of these days.
View SolutionConsider the frequency distribution table (Table 14.3, Example 4, Chapter 14), which gives the weights of 38 students of a class. (i) Find the probability that the weight of a student in the class lies in the interval 46-50 kg.(ii) Give two events in this context, one having probability 0 and the other having probability 1.
View Solution
Knowledge Check
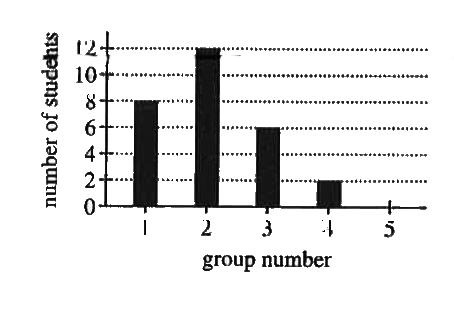
The graph below shows the number of students who were present on Thursday from each of the 5 groups in Ms. Meagan's class. What is the probability that a student selected at random from the class on Thrusday is in Group 4?
 A128B114C15D14
In a medical examination of students of a class, the following blood groups are recorded.

A student is selected at random from the class. The probability that he/she has blood group B, is
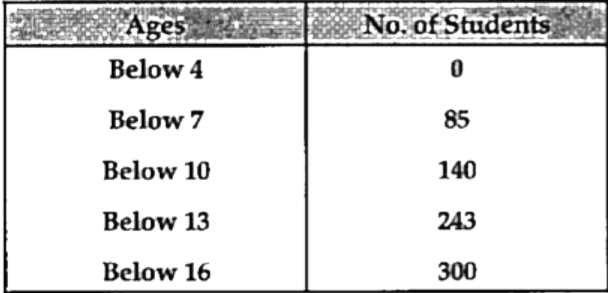
View SolutionConstruct the frequency distribution table from the following cumulative frequency table :

State the age - group which has the least number of students .
View SolutionIn a class of 125 students 70 passed in Mathematics, 55 in statistics, and 30 in both. Then find the probability that a student selected at random from the class has passed in only one subject.
View SolutionIn a class of 125 students 70 passed in Mathematics, 55 in statistics, and 30 in both. Then find the probability that a student selected at random from the class has passes in only one subject.
View SolutionFor the following data of daily wages (in rupees0 received by 30 labourers in a certain factory, construct a grouped frequency distribution table by dividing the range into class intervals of equal width, each corresponding to 2 rupees, in such a way that the mid-value of the first class interval corresponds to 12 rupees. 14,16,16,14,22,13,15,24,12,23,14,20,17,21,22,18,18,19,20,17,16,15,11,12,21,20,17,18,19,23
View SolutionFor the following data of daily wages (in rupees0 received by 30 labourers in a certain factory, construct a grouped frequency distribution table by dividing the range into class intervals of equal width, each corresponding to 2 rupees, in such a way that the mid-value of the first class interval corresponds to 12 rupees. 14,16,16,14,22,13,15,24,12,23,14,20,17,21,22,18,18,19,20,17,16,15,11,12,21,20,17,18,19,23
View Solution
Human blood can be classified into four common blood types—A, B, AB, and O. It is also characterized by the presence (+) or absence (–) of the rhesus factor. The table above shows the distribution of blood type and rhesus factor for a group of people. If one of these people who is rhesus negative (–) is chosen at random, the probability that the person has blood type B is 19 . What is the value of x ?
View Solution
