The given graph (Fig 15.8) describes the distances of a car from a city P at different times when it is travelling from City P to City Q, which are 350 km apart. Study the graph and answer the following:(i) What information is given on the two axes?(ii) From where and when did the car begin its journey?(iii) How far did the car go in the first hour?(iv) How far did the car go during (i) the 2nd hour? (ii) the 3rd hour?(v) Was the speed same during the first three hours? How do you know it?(vi) Did the car stop for some duration at any place? Justify your answer.(vii) When did the car reach City Q?
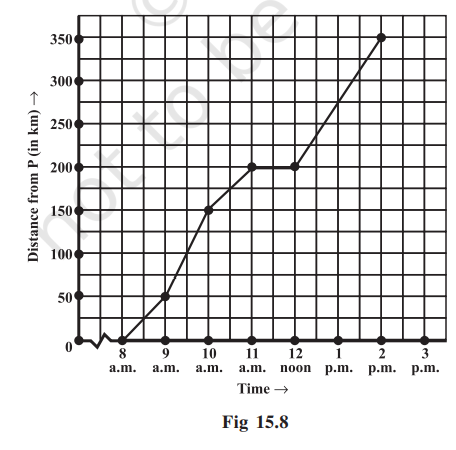
(i) On the two axes – the x-axis shows the time and y-axis shows the distance of the car from city P.
(ii) The car begins its journey from city P at 8:00 a.m.
(iii) The car covered a distance of 50km in the 1st hour.
(iv) The car covered a distance of(a) 100 km in the 2nd hour.
(b) 50km in the 3rd hour.
(v) No the speed was not same, because the distance covered per hour is not uniform.
(vi) Yes, the car stopped at a place during the time interval 11a.m. to 12a.m. as indicated by horizontal line segment during this period.
(vii) At 2p.m. the car reached at the city Q.
Topper's Solved these Questions
- INTRODUCTION TO GRAPHSBOOK - NCERT ENGLISHCHAPTER - INTRODUCTION TO GRAPHSEXERCISE - EXERCISE 15.2
4 Videos
- INTRODUCTION TO GRAPHSBOOK - NCERT ENGLISHCHAPTER - INTRODUCTION TO GRAPHSEXERCISE - EXERCISE 15.3
2 Videos
- FACTORISATIONBOOK - NCERT ENGLISHCHAPTER - FACTORISATIONEXERCISE - EXERCISE 14.1
3 Videos
- LINEAR EQUATIONS IN ONE VARIABLEBOOK - NCERT ENGLISHCHAPTER - LINEAR EQUATIONS IN ONE VARIABLEEXERCISE - EXERCISE 2.3
9 Videos
Similar Questions
Observe the bar graph given below :
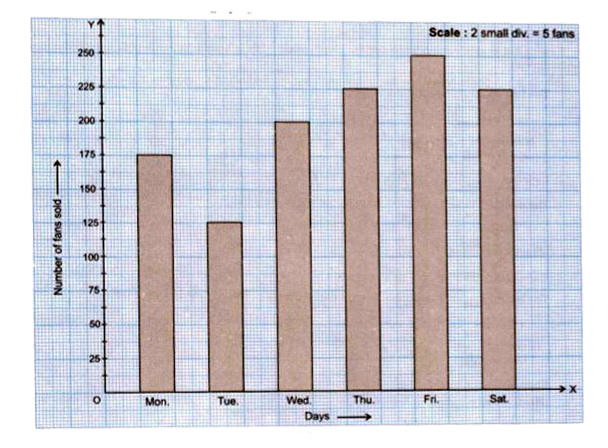
Read the bar graph carefully and answer the following questions :
What information is given by the bar graph?
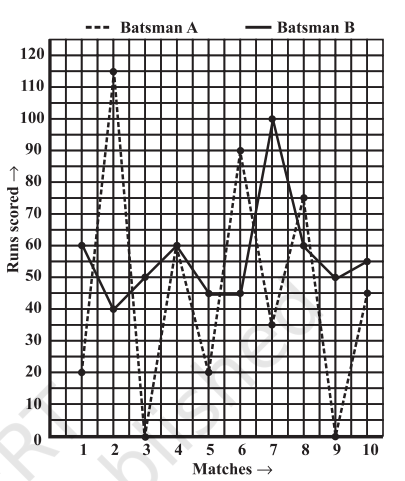
View Solution(A graph on “performance”)The given graph (Fig 15.7) represents the total runs scored by two batsmen A and B, during each of the ten different matches in the year 2007. Study the graph and answer the following questions.(i) What information is given on the two axes?(ii) Which line shows the runs scored by batsman A?(iii) Were the run scored by them same in any match in 2007? If so, in which match?(iv) Among the two batsmen, who is steadier? How do you judge it?
View SolutionA car covered a distance of 45 km from city A to city B. express this distance in meters using exponential notation .
View SolutionA car covers a distance of 160 km between two cities in 4 h. What is the average speed of the car?
View SolutionA car travels 28312 km in 423 hours. How far does this car go in 1 hour, travelling at the same speed?
View SolutionThe speed-time graph for a car is shown is Figure
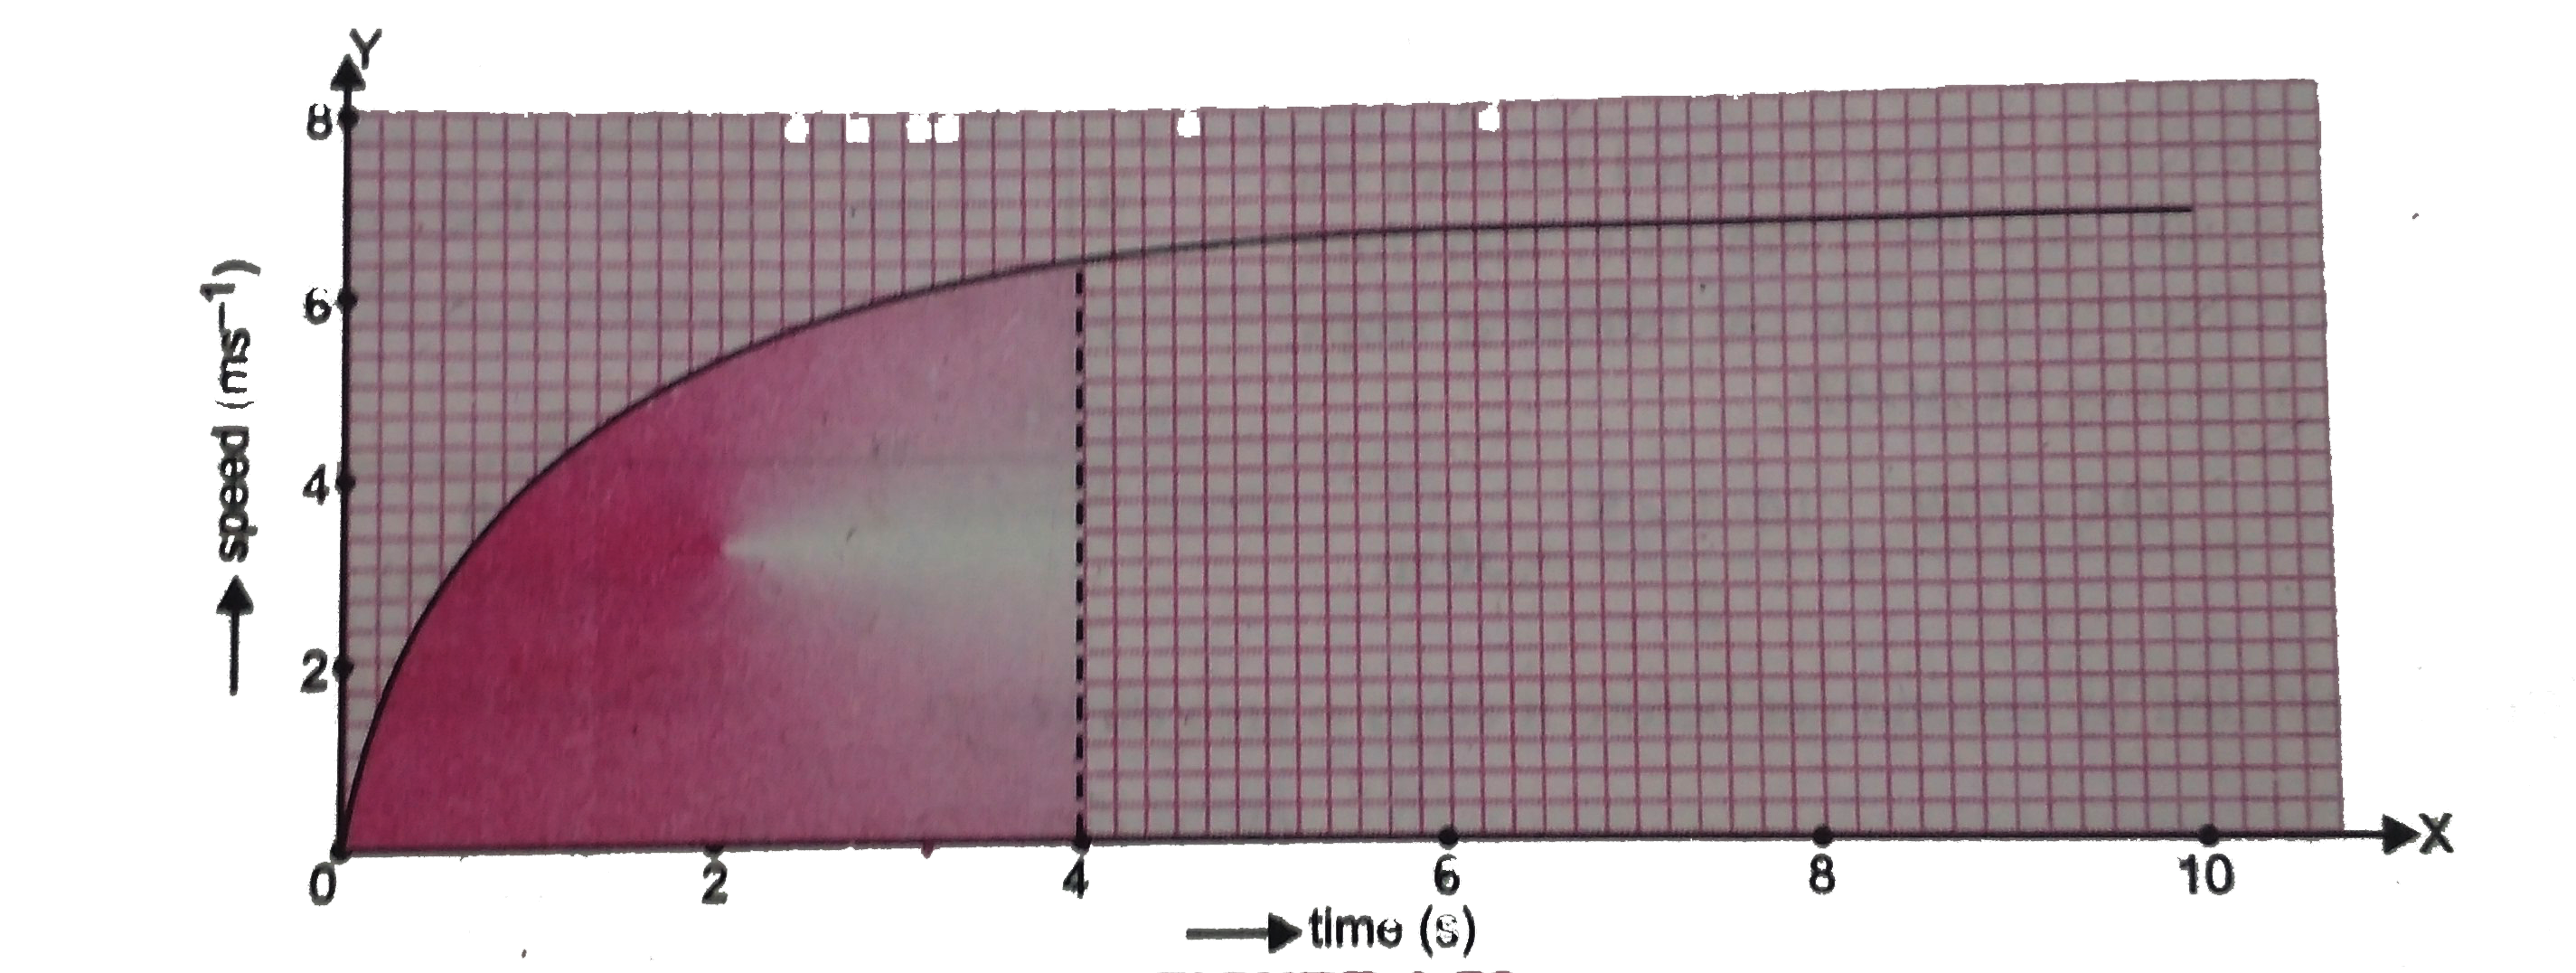
(a) Find how far does the car travel in the first 4 seconds. Shade the area on the graph that represents the distance travelled by the car during this period.
(b) Which part of the graph represents uniform motion of the car ?
View SolutionA train takes 3 h to travel from Agra to Delhi with a uniform speed of 65 km h−1'. Find the distance between the two cities.
View SolutionA car travelled from city A to city B with a uniform speed of 52 27 km per hour. Find the 3 ' distance between the two cities, if it took 438 hours for the car to reach city B from city A.
View SolutionThe following graph gives the minimum and maximum temperatures of various cities on a specific day. Read the graph and answer the following questions
Which are the hottest and the coldest cities on the given day?
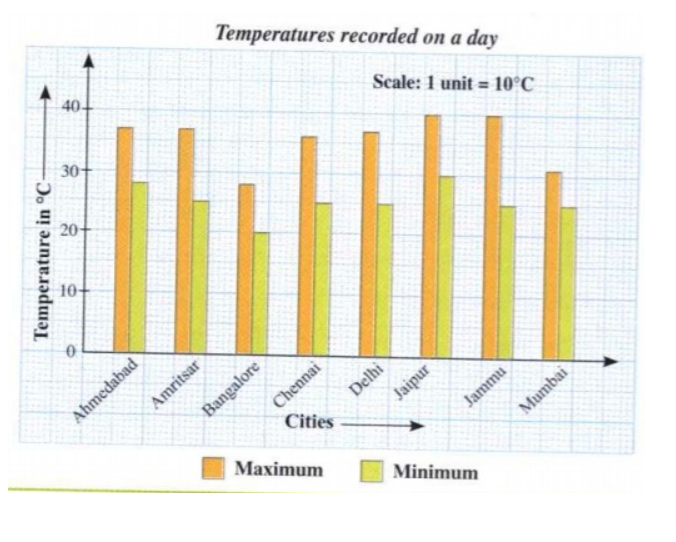
View SolutionThe following graph gives the minimum and maximum temperatures of various cities on a specific day. Read the graph and answer the following questions
Name the two cities where the maximum temperature of one city was less than the minimum temperature of the other city.

View Solution