Observe the bar graph given below :
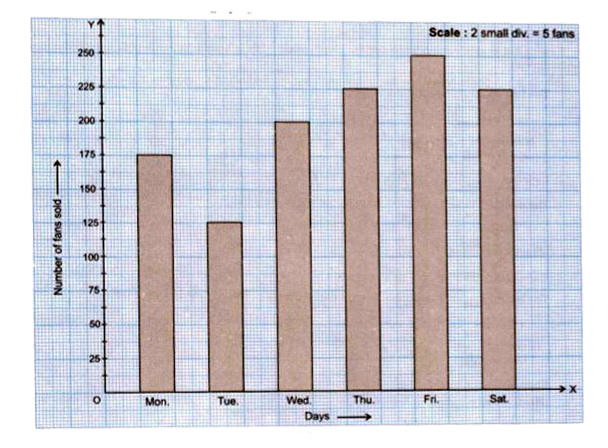
Read the bar graph carefully and answer the following questions :
What information is given by the bar graph?
Step by step video & image solution for Observe the bar graph given below : Read the bar graph carefully and answer the following questions : What information is given by the bar graph? by Maths experts to help you in doubts & scoring excellent marks in Class 7 exams.
Updated on:21/07/2023Topper's Solved these Questions
- DATA HANDLING BOOK - ICSECHAPTER - DATA HANDLING EXERCISE - EXERCISE 24A
18 Videos
- DATA HANDLING BOOK - ICSECHAPTER - DATA HANDLING EXERCISE - EXERCISE 24B
10 Videos
- DATA HANDLING AND MEASURES OF CENTRAL TENDENCYBOOK - ICSECHAPTER - DATA HANDLING AND MEASURES OF CENTRAL TENDENCYEXERCISE - TRY THIS
19 Videos
- DECIMALS BOOK - ICSECHAPTER - DECIMALS EXERCISE - TRY THIS
41 Videos
Similar Questions
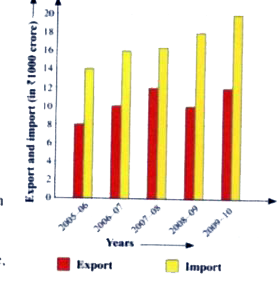
Read the bar graph and answer the following questions.
What information is given by the bar graph?
View SolutionObserve the bar graph given below :
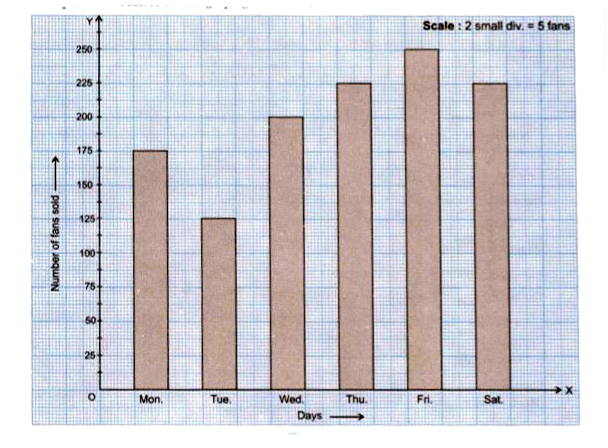
Read the bar graph carefully and answer the following questions :
What was the total sale during the week?
View SolutionObserve the bar graph given below :
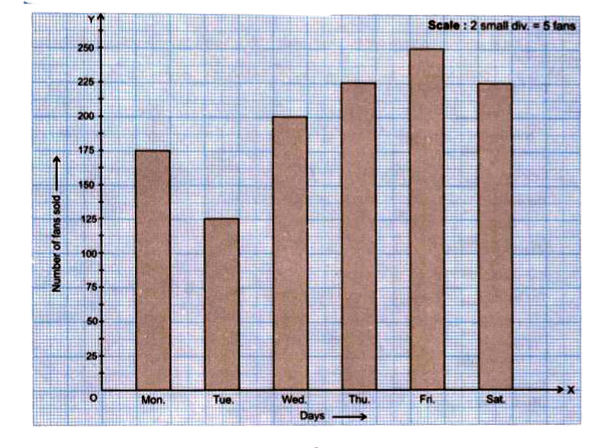
Read the bar graph carefully and answer the following questions :
What is the ratio between the minimum sale and the maximum sale?
View SolutionObserve the bar graph given below :
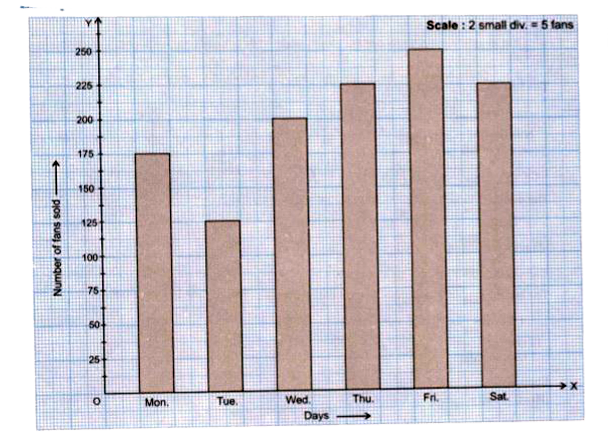
Read the bar graph carefully and answer the following questions :
On which day of the week was the sale maximum?
View SolutionObserve the bar graph given below :
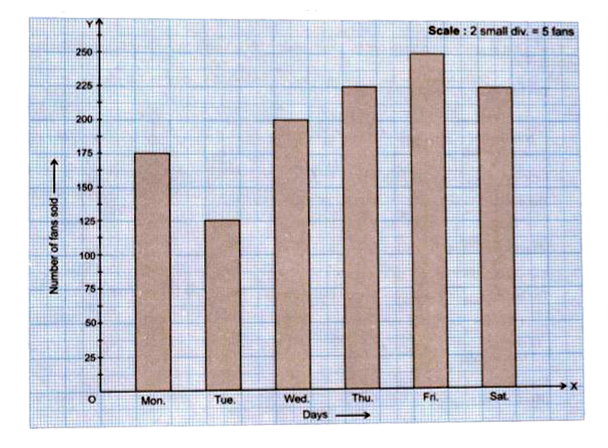
Read the bar graph carefully and answer the following questions :
On which day of the week there was maximum increase in sale compared to the previous day?
View SolutionRead the given bar graph and answer the question that follow :
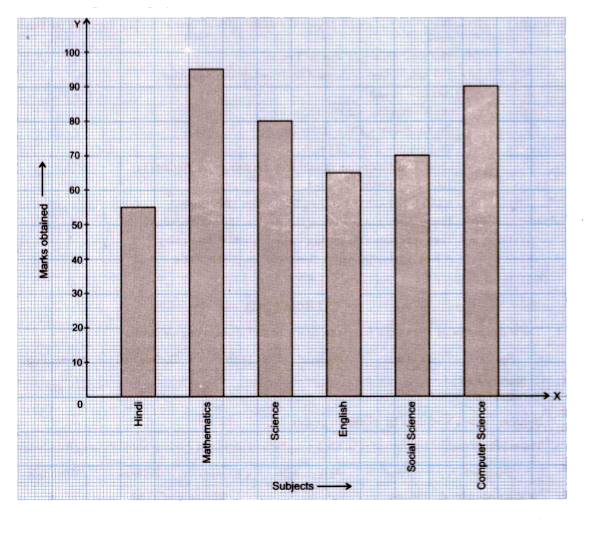
What information is represented by the bar graph?
View SolutionLook at the bar graph given below.
Read it care fully and answer the following questions.
(i) What information does the bar graph give?
(ii) In which subject is the student very good?
(iii) In which subject is the poor? (iv) What is the average of his marks?
View SolutionRead the bar graph given below :
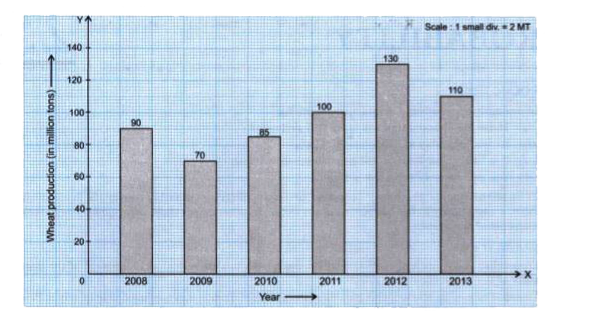
What information is given by the bar graph?
View SolutionRead the bar graph given in Figure and answer the following questions: What information is given by the bar graph? What was the crop-production of rice in 1970-71? What is the difference between the maximum and minimum production of rice?
View SolutionRead the bar graph given in Figure and answer the following questions: What information is given by the bar graph? What was the expenditure on health and family planning in year 1982-83 In which year is the increase in expenditure maximum over the expenditure in previous year? What is the maximum increase?
View Solution