Read the adjoining bar graph showing the number ofstudents in a particular class of a school. Answer thefollowing questions :(a) What is the scale of this graph?(b) How many new students are added every year?(c) Is the number of students in the year 2003 twice that in the year 2000?
To solve the questions based on the bar graph showing the number of students in a particular class of a school, we will break it down step by step.
Step 1: Determine the scale of the graph
- Observation: Look at the y-axis of the bar graph. Each unit on the y-axis represents a certain number of students.
- Calculation: If one unit on the y-axis corresponds to 10 students, then we can conclude that the scale of the graph is 1 unit = 10 students.
Step 2: Find out how many new students are added every year
- Observation: Check the number of students for each year from the graph:
- Year 2000: 30 students
- Year 2001: 40 students
- Year 2002: 50 students
- Year 2003: 60 students
- Calculation:
- From 2000 to 2001: 40 - 30 = 10 students added
- From 2001 to 2002: 50 - 40 = 10 students added
- From 2002 to 2003: 60 - 50 = 10 students added
- Conclusion: Every year, 10 new students are added.
Step 3: Check if the number of students in 2003 is twice that in 2000
- Observation: From the graph:
- Number of students in 2000: 30
- Number of students in 2003: 60
- Calculation:
- To check if 60 is twice 30, we calculate: 2 * 30 = 60.
- Conclusion: Yes, the number of students in the year 2003 (60) is indeed twice that in the year 2000 (30).
Summary of Answers:
(a) The scale of the graph is 1 unit = 10 students.
(b) Every year, 10 new students are added.
(c) Yes, the number of students in the year 2003 is twice that in the year 2000.
- Observation: Look at the y-axis of the bar graph. Each unit on the y-axis represents a certain number of students.
- Calculation: If one unit on the y-axis corresponds to 10 students, then we can conclude that the scale of the graph is 1 unit = 10 students.
- Observation: Check the number of students for each year from the graph:
- Year 2000: 30 students
- Year 2001: 40 students
- Year 2002: 50 students
- Year 2003: 60 students
- Calculation:
- From 2000 to 2001: 40 - 30 = 10 students added
- From 2001 to 2002: 50 - 40 = 10 students added
- From 2002 to 2003: 60 - 50 = 10 students added
- Conclusion: Every year, 10 new students are added.
- Observation: From the graph:
- Number of students in 2000: 30
- Number of students in 2003: 60
- Calculation:
- To check if 60 is twice 30, we calculate: 2 * 30 = 60.
- Conclusion: Yes, the number of students in the year 2003 (60) is indeed twice that in the year 2000 (30).
(a) The scale of the graph is 1 unit = 10 students.
(b) Every year, 10 new students are added.
(c) Yes, the number of students in the year 2003 is twice that in the year 2000.
Topper's Solved these Questions
- DATA HANDLINGBOOK - NCERT ENGLISHCHAPTER - DATA HANDLINGEXERCISE - EXERCISE 9.3
3 Videos
- DATA HANDLINGBOOK - NCERT ENGLISHCHAPTER - DATA HANDLINGEXERCISE - EXERCISE 9.4
4 Videos
- DATA HANDLINGBOOK - NCERT ENGLISHCHAPTER - DATA HANDLINGEXERCISE - EXERCISE 9.1
7 Videos
- BASIC GEOMETRICAL IDEASBOOK - NCERT ENGLISHCHAPTER - BASIC GEOMETRICAL IDEASEXERCISE - EXERCISE 4.6
4 Videos
- DECIMALSBOOK - NCERT ENGLISHCHAPTER - DECIMALSEXERCISE - EXERCISE 8.3
2 Videos
Similar Questions
In a village six fruit merchants sold the following number of fruit baskets in a particular season : Observe this pictograph and answer the following questions : (a) Which merchant sold the maximum number of baskets? (b) How many fruit baskets were sold by Anwar? (c) The merchants who have sold 600 or more number of baskets are planning to buy a godown for the next season. Can you name them?
View SolutionRead the bar graph shown in Figure and answer the following questions: What is the information given by the bar graph? What is the order of the change of number of students over several years? State whether true or false. The enrolment during 1996-97 is twice that of 1995-96
View SolutionThe following bar graph represents the data for different sizes of shoes worn by the students in a school. Read the graph and answer the following questions.
(i)What are the different numbers of the shoe-worn by the students?
(ii)What is the number of students wearing shoe No. 6?
(iii)Which shoe number is worn by the maximum number of students?
(iv)Which shoe number is worn by the minimum number of students?
View SolutionThe following bar graph (Figure) represents the heights (in cm) of 50 students of Class XI of a particular school. Study the graph and answer the following questions: What percentage of the total number of students have their heights more than 149 cm? How many students in the class are in the range of maximum height of the class? The school wants to provide a particular type of tonic to each student below the height of 150cm to improve his height. If the cost of the tonic for each student comes out to be Rs. 55, how much amount of money is required? How many students are in the range of shortest height of the class? State whether true or false: There are 9 students in the class whose heights are in the range of 155-159 cm. Maximum height (in cm) of a student in the class is 17. There are 29 students in the class whose heights are in the range of 145-154 cm. Minimum height (in cm) of a student is the class is in the range of 140-144cms. The number of students in the class having their heights less than 150cm is 12. There are 14 students each of whom has height more than 154 cm.
View SolutionRead the bar graph shown in Figure and answer the following questions: What is the information given by the bar graph? How many tickets of Assam State Lottery were sold by the agent? Of which state, were the maximum number of tickets sold? State whether true or false. The maximum number of tickets sold is three times the minimum number of tickets sold. Of which state were the minimum number of tickets sold?
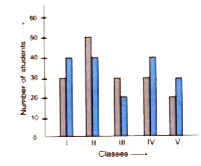
View SolutionExmine the given graph carefully.

In the graph show above represents the number of girls in a particular class and represents the number of boys in the same class.
Read and answer the following questions.
(i) Which class has the least number of students ?
(ii) Which class has maximum number of students ?
(iii) What is the ratio between the number of girls and the number of boys of class V.
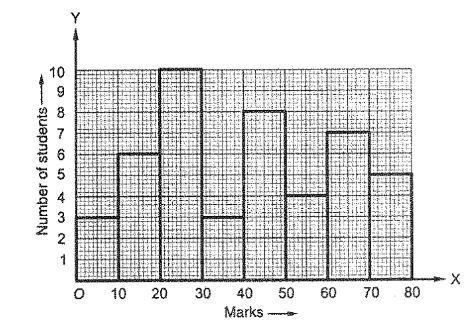
View SolutionThe following histogram depicts the marks obtained by 45 students of a class: Figure: Look at the histogram and answer the following questions: What is the class size? How many students obtained less than 10 marks? How many students obtained 30 or more marks but less than 40? What is the interval of highest marks and how many students are there in this interval? If passing marks are 30, what is the number of failures?

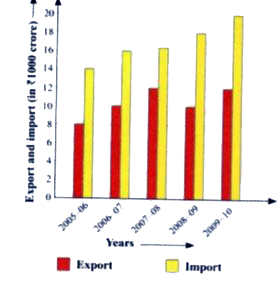
View SolutionRead the bar graph and answer the following questions.
in which year the value of the export is greater than that of the import?

View SolutionStudy the bar graph representing the number of persons in various age groups in a town shown in Figure. Observe the bar graph and answer the following questions: What is the percentage of the youngest age-group persons over those in the oldest age group? What is the total population of the town? What is the number of persons in the age-group 60-65? How many persons are more in the age-group 10-15 then in the age group 30-35? What is the age-group of exactly 1200 persons living in the town? What is the total number of persons living in the town in the age-group 50-55? What is the total number of persons living in the town in the age-groups 10-15 and 60-65? Whether the population in general increases, decreases or remains constant with the increase in the age-group.
View SolutionTotal number of students of a school in different years is shown in the following table: Year, No. of Students 1996 1998 2000 2002 2004, 400 550 450 600 650 Represent the above data by a pictograph. Prepare a pictograph of students using one symbol an icon of a student to represent 100 students and answer the following questions: How many symbols represent total number of students in the year 2002? How many symbols represent total number of students in the year 1998? Prepare another pictograph of students using any other symbol each representing 50 students. Which pictograph do you find more informative?
View Solution
