The enrolment in a school during six consecutive years was as follows:1555, 1670, 1750, 2013, 2540, 2820Find the mean enrolment of the school for this period
To find the mean enrolment of the school over the six consecutive years, we will follow these steps:
Step 1: Write down the enrolment figures
The enrolment figures for the six consecutive years are:
- Year 1: 1555
- Year 2: 1670
- Year 3: 1750
- Year 4: 2013
- Year 5: 2540
- Year 6: 2820
Step 2: Calculate the sum of the enrolment figures
Now, we need to add all these figures together:
1555+1670+1750+2013+2540+2820
Step 3: Perform the addition
Let's add them step by step:
1. 1555+1670=3225
2. 3225+1750=4975
3. 4975+2013=6988
4. 6988+2540=9528
5. 9528+2820=12348
So, the total sum of enrolment over the six years is 12348.
Step 4: Divide the total sum by the number of years
To find the mean, we divide the total sum by the number of years (which is 6):
Mean=123486
Step 5: Perform the division
Now, let's calculate:
123486=2058
Final Answer
The mean enrolment of the school for this period is 2058.
---
The enrolment figures for the six consecutive years are:
- Year 1: 1555
- Year 2: 1670
- Year 3: 1750
- Year 4: 2013
- Year 5: 2540
- Year 6: 2820
Now, we need to add all these figures together:
1555+1670+1750+2013+2540+2820
Let's add them step by step:
1. 1555+1670=3225
2. 3225+1750=4975
3. 4975+2013=6988
4. 6988+2540=9528
5. 9528+2820=12348
To find the mean, we divide the total sum by the number of years (which is 6):
Mean=123486
Now, let's calculate:
123486=2058
The mean enrolment of the school for this period is 2058.
Topper's Solved these Questions
- DATA HANDLINGBook:NCERT ENGLISHChapter:DATA HANDLINGExercise:EXERCISE 3.2
Explore 5 Videos
- DATA HANDLINGBook:NCERT ENGLISHChapter:DATA HANDLINGExercise:EXERCISE 3.3
Explore 3 Videos
- CONGRUENCE OF TRIANGLESBook:NCERT ENGLISHChapter:CONGRUENCE OF TRIANGLESExercise:SOLVED EXAMPLES
Explore 9 Videos
- EXPONENTS AND POWERSBook:NCERT ENGLISHChapter:EXPONENTS AND POWERSExercise:EXERCISE 13.2
Explore 5 Videos
Similar Questions
The enrolment in a school during six consecutive years was as follows: 1555, 1670, 1750, 2013, 2540, 2820 Find the mean enrolment of the school for this period
View SolutionThe following table shows the ages of the patients admitted in a hospital during a year: Age (in years): 5-15 15-25 25-35 35-45 45-55 55-65 No. of students: 6 11 21 23 14 5 Find the mode and the mean of the data given above. Compare and interpret the two measures of central tendency.
View Solution
Knowledge Check
At Lincoln High School, approximately 7 percent of enrolled juniors and 5 percent of enrolled seniors were inducted into the National Honor Society last year. If there were 562 juniors and 602 seniors enrolled at Lincoln High School last year, which of the following is closest to the total number of juniors and seniors at Lincoln High School last year who were inducted into the National Honor Society?
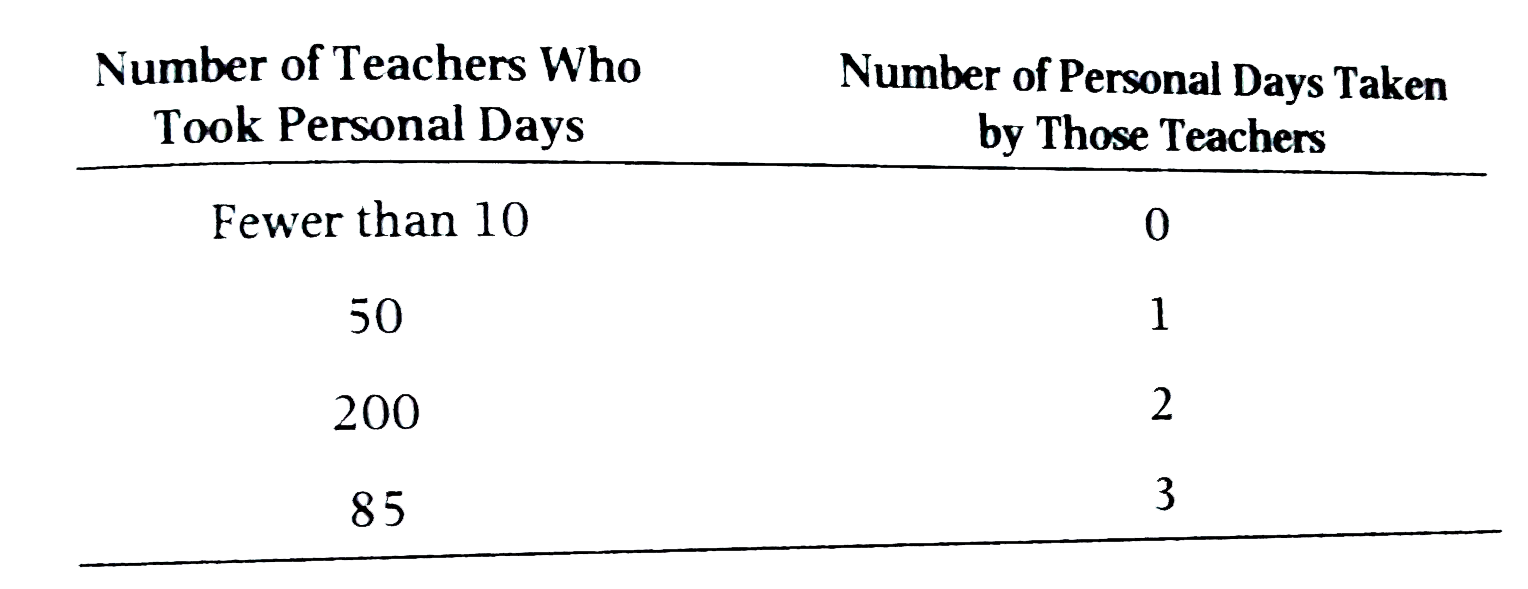
A140B69C39D30In a certain school district , teachers are allowed to take three personal days, at full pay , during one school year. Here is a summary of the number of personal days taken by teachers in 2013-2014 .

From this table you can accurately find
I.the arithmetic mean of personal days taken
II. The median number of personal days taken
III. The mode of the number of personal days takenAI onlyBII onlyCIII onlyDII and III only
The ages (in years) of 50 students of a class in a school are given below:
Age (in years): 14 15 16 17 18
Numbers of students: 15 14 10 8 3
Find the mean age.
View SolutionThe following are the ages (in years) of 12 teachers in a school :
36, 44, 39, 46, 35, 53, 38, 42, 55, 45, 49, 40
Arrange the above data in an ascending order and answer the questions given below:
What is the mean age of the teachers in the school?
View SolutionNumber of workshops organized by a school in different areas during the last five years are as follows: years, No. of workshops 1995-1996 1996-1997 1997-1998 1998-1999 1999-2000, 25 30 42 50 65 Draw a histogram representing the above data.
View SolutionThe following table shows the ages of the patients admitted in a hospital during a year:Find the mode and the mean of the data given above. Compare and interpret the two measures of central tendency.
View SolutionTotal number of students of a school in different years is shown in the following table: Year, No. of Students 1996 1998 2000 2002 2004, 400 550 450 600 650 Represent the above data by a pictograph. Prepare a pictograph of students using one symbol an icon of a student to represent 100 students and answer the following questions: How many symbols represent total number of students in the year 2002? How many symbols represent total number of students in the year 1998? Prepare another pictograph of students using any other symbol each representing 50 students. Which pictograph do you find more informative?
View SolutionThe following distribution gives the state-wise teacher-student ratio in higher secondary schools of India. Find the mode and mean of this data. Interpret, the two measures: Number of students per Teacher Number of States/U.T. 15-20 3 20-25 8 25-30 9 30-35 10 35-40 3 40-45 0 45-50 0 50-55 2
View Solution