Total number of students of a school in different years is shown in the following table: Year, No. of Students 1996 1998 2000 2002 2004, 400 550 450 600 650 Represent the above data by a pictograph. Prepare a pictograph of students using one symbol an icon of a student to represent 100 students and answer the following questions: How many symbols represent total number of students in the year 2002? How many symbols represent total number of students in the year 1998? Prepare another pictograph of students using any other symbol each representing 50 students. Which pictograph do you find more informative?
To solve the problem of representing the total number of students in a school over different years using pictographs, we will follow these steps:
Step 1: Understand the Data
We have the following data for the number of students in different years:
| Year | No. of Students |
|------|-----------------|
| 1996 | 400 |
| 1998 | 550 |
| 2000 | 450 |
| 2002 | 600 |
| 2004 | 650 |
Step 2: Create the First Pictograph
We will use one symbol (an icon of a student) to represent 100 students.
- 1996: 400 students = 4 symbols
- 1998: 550 students = 5 symbols + 1/2 symbol (for the extra 50 students)
- 2000: 450 students = 4 symbols + 1/2 symbol
- 2002: 600 students = 6 symbols
- 2004: 650 students = 6 symbols + 1/2 symbol
The pictograph will look like this:
1996: 👤👤👤👤
1998: 👤👤👤👤👤 (1/2)
2000: 👤👤👤👤 (1/2)
2002: 👤👤👤👤👤👤
2004: 👤👤👤👤👤👤 (1/2)
Step 3: Answer the Questions
1. How many symbols represent total number of students in the year 2002?
- In 2002, there are 6 symbols.
2. How many symbols represent total number of students in the year 1998?
- In 1998, there are 5 complete symbols and 1 half symbol, which totals to 5.5 symbols.
Step 4: Create the Second Pictograph
Now, we will create another pictograph using a different symbol, where each symbol represents 50 students.
- 1996: 400 students = 8 symbols
- 1998: 550 students = 11 symbols + 1/2 symbol
- 2000: 450 students = 9 symbols
- 2002: 600 students = 12 symbols
- 2004: 650 students = 12 symbols + 1/2 symbol
The pictograph will look like this:
1996:𐀀�𐀀�𐀀�𐀀�𐀀�𐀀�𐀀�𐀀�1998:𐀀�𐀀�𐀀�𐀀�𐀀�𐀀�𐀀�𐀀�𐀀�𐀀�𐀀�𐀀�(12)2000:𐀀�𐀀�𐀀�𐀀�𐀀�𐀀�𐀀�𐀀�𐀀�𐀀�𐀀�𐀀�𐀀�(12)2002:𐀀�𐀀�𐀀�𐀀�𐀀�𐀀�𐀀�𐀀�𐀀�𐀀�𐀀�𐀀�𐀀�𐀀�2004:𐀀�𐀀�𐀀�𐀀�𐀀�𐀀�𐀀�𐀀�𐀀�𐀀�𐀀�𐀀�𐀀�𐀀�(12)
Step 5: Determine Which Pictograph is More Informative
- The second pictograph (using 50 students per symbol) is more informative because it provides a finer granularity of data, allowing us to see smaller increments in the number of students.
We have the following data for the number of students in different years:
|------|-----------------|
| 1996 | 400 |
| 1998 | 550 |
| 2000 | 450 |
| 2002 | 600 |
| 2004 | 650 |
We will use one symbol (an icon of a student) to represent 100 students.
- 1998: 550 students = 5 symbols + 1/2 symbol (for the extra 50 students)
- 2000: 450 students = 4 symbols + 1/2 symbol
- 2002: 600 students = 6 symbols
- 2004: 650 students = 6 symbols + 1/2 symbol
1996: 👤👤👤👤
1998: 👤👤👤👤👤 (1/2)
2000: 👤👤👤👤 (1/2)
2002: 👤👤👤👤👤👤
2004: 👤👤👤👤👤👤 (1/2)
1. How many symbols represent total number of students in the year 2002?
- In 2002, there are 6 symbols.
- In 1998, there are 5 complete symbols and 1 half symbol, which totals to 5.5 symbols.
Now, we will create another pictograph using a different symbol, where each symbol represents 50 students.
- 1998: 550 students = 11 symbols + 1/2 symbol
- 2000: 450 students = 9 symbols
- 2002: 600 students = 12 symbols
- 2004: 650 students = 12 symbols + 1/2 symbol
- The second pictograph (using 50 students per symbol) is more informative because it provides a finer granularity of data, allowing us to see smaller increments in the number of students.
Topper's Solved these Questions
Similar Questions
Explain the following: (i) Circle (ii) Radius (iii) Centre (iv) Diameter (v) Chord (vi) Interior of a circle
View SolutionFollowing table shows the number of bicycles manufactured in a factory during the years 1998 to 2002. Illustrate this data using a bar graph. Choose a scale of your choice
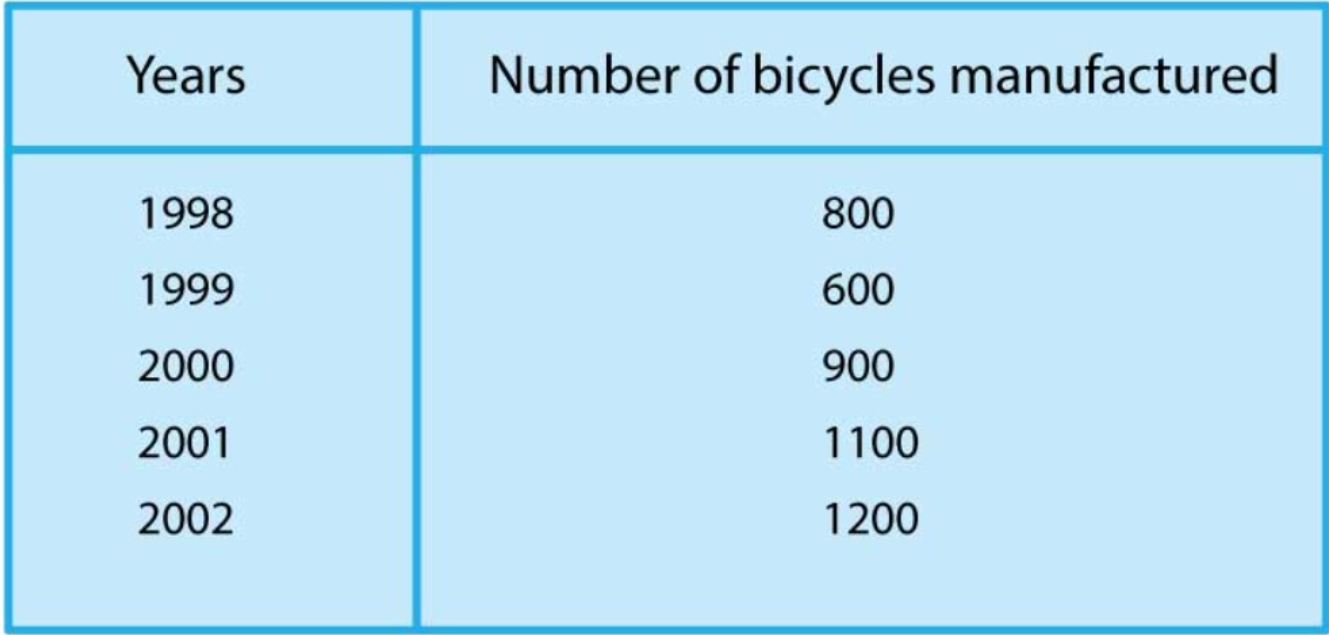
View SolutionTotal number of students of a school in different years is shown in the following table
View SolutionTotal number of students of a school in different years is shown in the following table: Year, No. of Students 1996 1998 2000 2002 2004, 400 550 450 600 650 Represent the above data by a pictograph. Prepare a pictograph of students using one symbol an icon of a student to represent 100 students and answer the following questions: How many symbols represent total number of students in the year 2002? How many symbols represent total number of students in the year 1998? Prepare another pictograph of students using any other symbol each representing 50 students. Which pictograph do you find more informative?
View Solutionविभिन्न वर्षो में एक स्कूल में विद्यार्थियों की कुल संख्या निम्म द्वारा प्रदर्शित है :
YearTotal Number Boys 1996: 4001998: 5352000: 4722002: 6002004: 623
A. (a) एक संकेत का प्रयोग करके , जो 100 विद्यार्थियों को निरूपित करता हे, एक चित्रालेख बनाये और निम्न प्रश्नो के उत्तर दीजिये :
वर्ष 2002 में कुल विद्यार्थियों की संख्या को कितने संकेत निरूपित कर रहे है ?
(b) वर्ष -1998 में कुल विद्यार्थियों की संख्या को कितने संकेत निरूपित कर रहे है ?
B. कोई और संकेत लेकर , जो 50 विद्यार्थीयों को निरूपित करता हो, अन्य चित्रालेख बनाइए । कौन - सा चित्रालेख अधिक सुचनाप्रद है ?
View SolutionTotal number of students of a school in different years is shown in the following table
View SolutionTotal number of students of a school in different years is shown in the following table A. Prepare a pictograph of students using one symbol ? To represent 100 students and answer the following questions: (a) How many symbols represent total number of students in the year 2002?
View SolutionTotal number of students of a school in different years is shown in the following table A. Prepare a pictograph of students using one symbol ? To represent 100 students and answer the following questions: (b) How many symbols represent total number of students in the year 1998?
View SolutionTotal number of students of a school in different years is shown in the following table B Prepare another pictograph of students using any other symbol each representing 50 students. Which pictograph do you find more informative?
View Solutionविभिन्न वर्षों में स्कूल के छात्रों की कुल संख्या निम्नांकित सारणी द्वारा प्रदर्शित है :
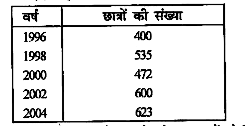
एक संकेत का प्रयोग करके जो 100 छात्रों को निरूपित करता है। , एक चित्रलेखा बनाइये और निम्नलिखित प्रश्नों के उत्तर दीजिये।
वर्ष 2002 में कुल छात्रों की संख्या को कितने संकेत निरूपित कर रहे हैं ?
View Solutionविभिन्न वर्षों में स्कूल के छात्रों की कुल संख्या निम्नांकित सारणी द्वारा प्रदर्शित है :
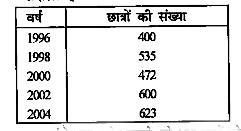
एक संकेत का प्रयोग करके जो 100 छात्रों को निरूपित करता है। , एक चित्रलेखा बनाइये और निम्नलिखित प्रश्नों के उत्तर दीजिये।
वर्ष 1998 में कुल छात्रों की संख्या को कितने संकेत निरूपित कर रहे हैं ?
View Solutionविभिन्न वर्षों में एक स्कूल के विद्यार्थियों की कुल संख्या निम्न सारणी द्वारा प्रदर्शित है :
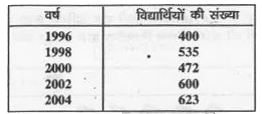
एक संकेत का प्रयोग करके, जो 100 विद्यार्थियों को निरूपित करता है, एक चित्रालेख बनाइए और निम्न प्रश्न के उत्तर दीजिए वर्ष-2002 में कुल विद्यार्थियों की संख्या को कितने संकेत निरूपित कर रहे हैं ?
View Solutionविभिन्न वर्षों में एक स्कूल के विद्यार्थियों की कुल संख्या निम्न सारणी द्वारा प्रदर्शित है :
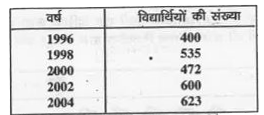
एक संकेत का प्रयोग करके, जो 100 विद्यार्थियों को निरूपित करता है, एक चित्रालेख बनाइए और निम्न प्रश्नों के उत्तर दीजिए
वर्ष-1998 में कुल विद्यार्थियों की संख्या को कितने संकेत निरूपित कर रहे हैं ?
View SolutionTotal number of students of a school in different years is shown in the following table:
Prepare another pictograph of students using any other symbol each representing 50 students.Which pictograph do you find more informative?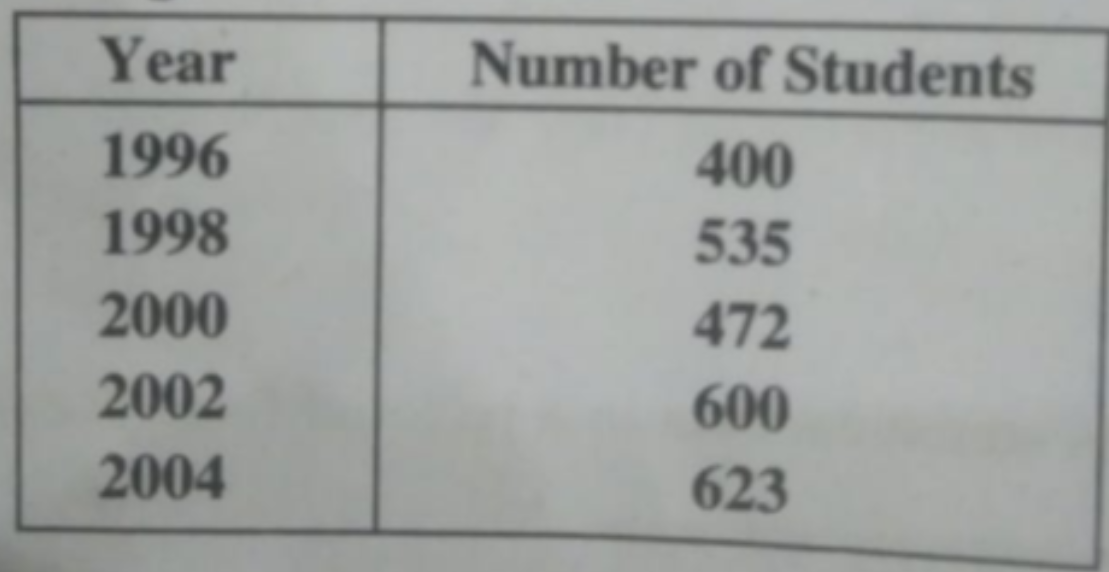 .
.
View SolutionNumber of students joining and leaving a school at the beginning of each year from 1993 to 1998 Number of students in the school in 1992 = 1500 How many students were there in the school in the year 1996?
View Solution
