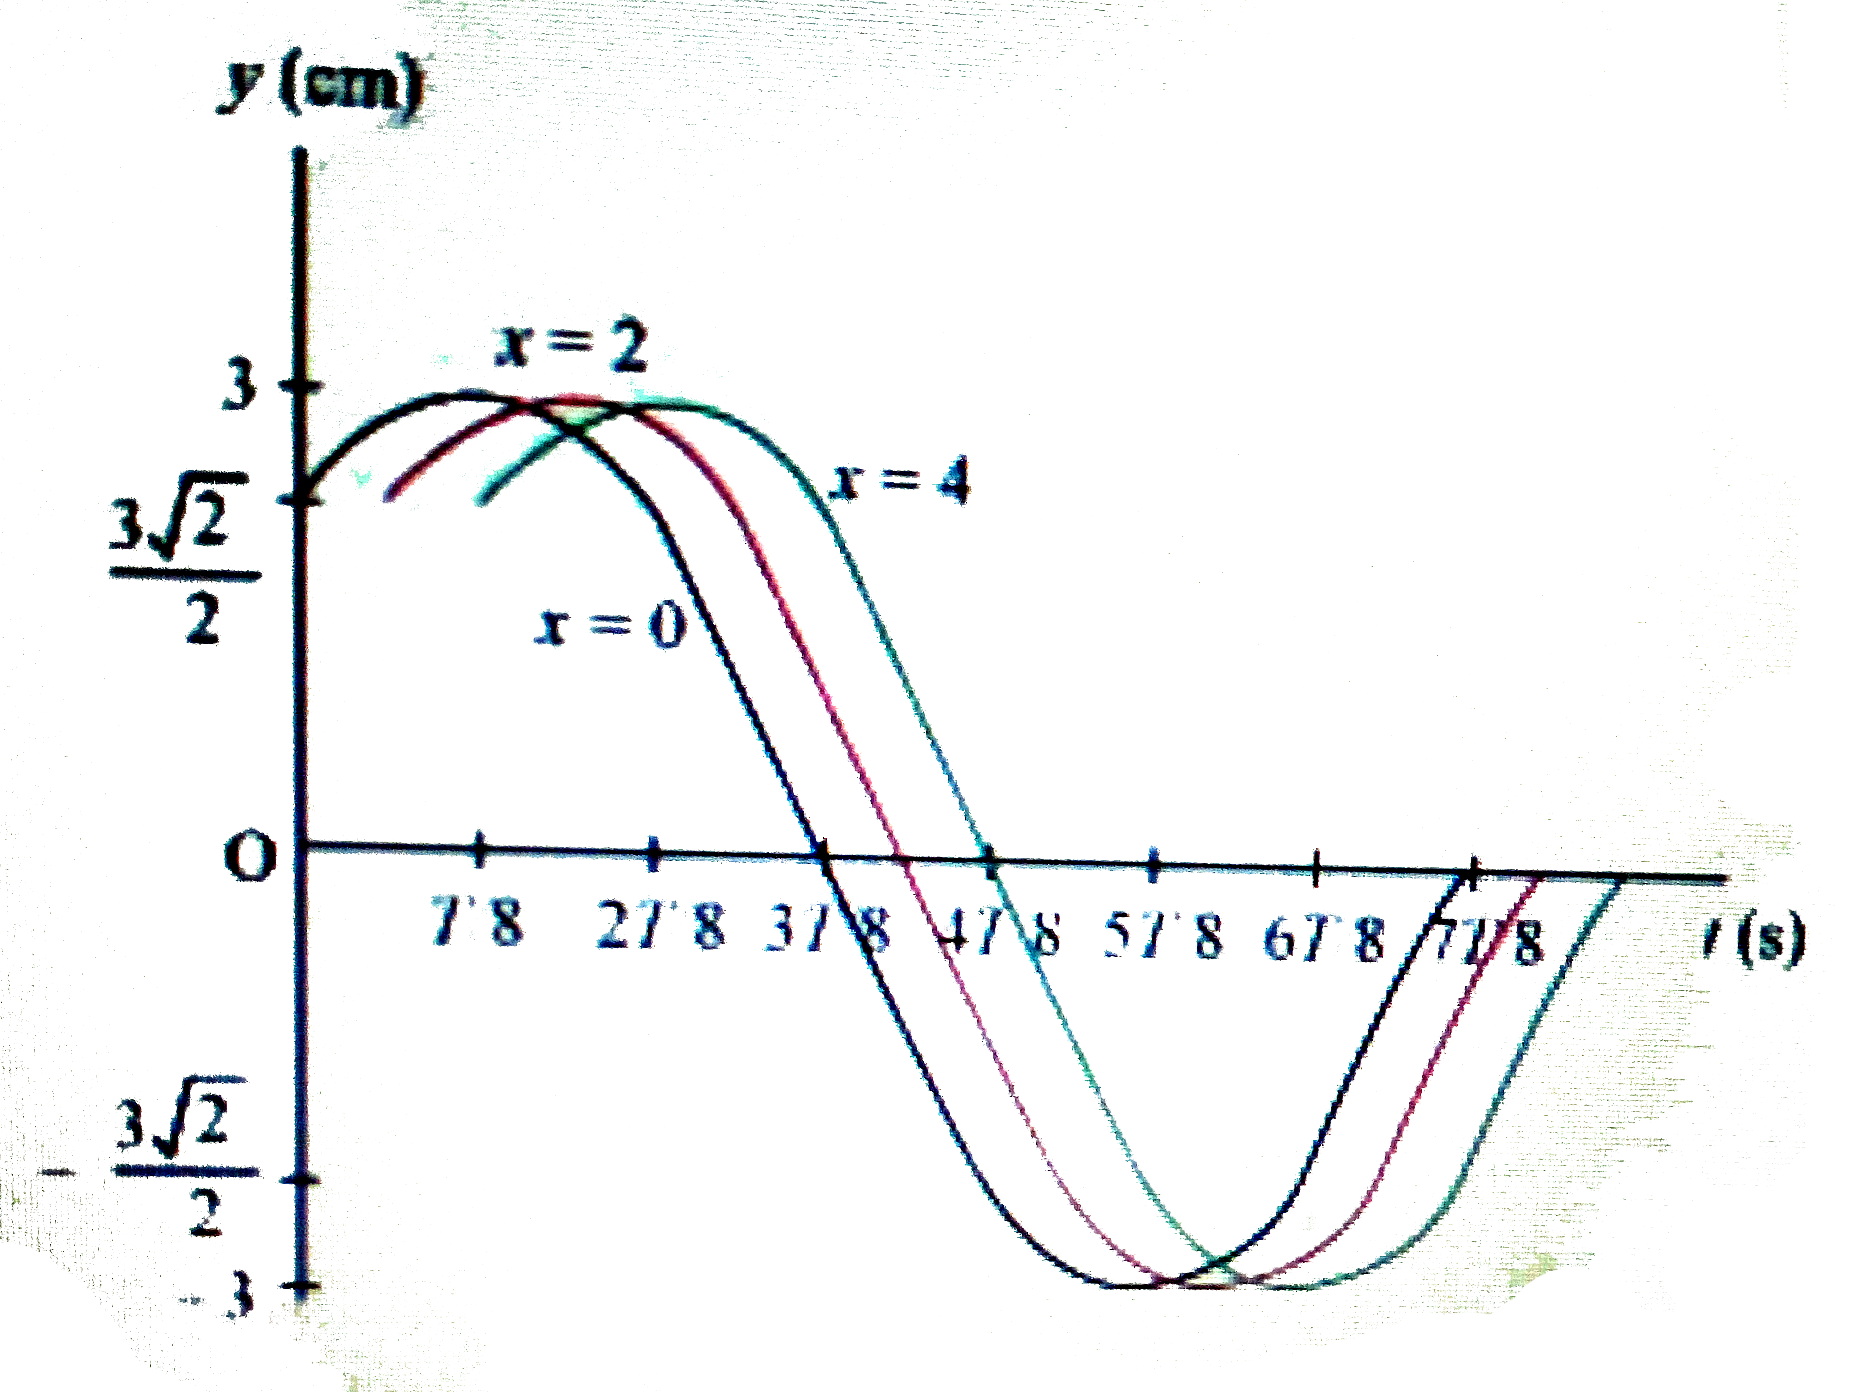
For the wave described in Exercise 15.8, plot the displacement (y) versus (t) graphs for x = 0, 2 and 4 cm. What are the shapes of these graphs? In which aspects does the oscillatory motion in travelling wave differ from one point to another: amplitude, frequency or phase?
All the waves have different phases.
The given transverse harmonic wave is:
y(x,t)=3.0sin(36+0.018x+π4) …(i)
For x = 0, the equation reduces to:
y(0,t)=3.0sin(36t+π4)
Also, ω=2πT=36rad/s−1
∴T=π8s
Now, plotting y vs. t graphs using the different values of t, as listed in the given table.

For x = 0, x = 2, and x = 4, the phases of the three waves will get changed. This is because amplitude and frequency are invariant for any change in x. The y–t plots of the three waves are shown in the given figure.

Topper's Solved these Questions
Similar Questions
For the wave described in exercise 27 plot the displacement (y) versus (t) graphs for x=0,2 and 4m. What are the shaps of these graphs ? In which aspects does the oscillatory motion in travelling wave differ from one point to another amplitude, frequency or phase?
View SolutionFor the wave described in the displacement (y) versus (t) graphs for x = 0, 2 and 4 cm. What are the shapes of these graphs ? In which aspects does the oscillatory motion in a travelling wave differ from one point to another : amplitude, frequency or phase ?
View Solution
Knowledge Check
For the harmonic travelling wave y=2cos2pi(10t-0.0080x+3.5) where x and y ar in cm and t is in second. What is the phase diffference between the oscillatory motion at two points separated by a distance of
A4mB0.5mCλ2D3λ4 (at a given instant of time)
For the wave y= 3.0 sin(36t + 0.018x + pi/4) plot the displacement (y) versus (t) graphs for x=0,. What is the shaps of the graph ? In which aspects does the oscillatory motion in travelling wave differ from one point to another amplitude, frequency or phase?
View SolutionFor the harmonic travelling wave y=2cos2pi(10t-0.0080x+3.5) where x and y ar in cm and t is in second. What is the phase diffference between the oscillatory motion at two points separated by a distance of
View SolutionMany interesting wave phenomenon in nature cannot just be described by a single wave, instead one must analyze complex wave forms in terms of a combinations of many travelling waves. To analyze such wave combinations, we make use of the principle of superposition which states that if two or more travelling waves are moving through a medium and combine at a given point, the resultant displacement of the medium at that point is sum of the displacement of individual waves. Two pulses travelling on the same string are described by
y1=5(3x−4t)2+2 and y2=−5(3x+4t−6)2+2
The direction in which each pulse is travelling
View SolutionMany interesting wave phenomenon in nature cannot just be described by a single wave, instead one must analyze complex wave forms in terms of a combinations of many travelling waves. To analyze such wave combinations, we make use of the principle of superposition which states that if two or more travelling waves are moving through a medium and combine at a given point, the resultant displacement of the medium at that point is sum of the displacement of individual waves. Two pulses travelling on the same string are described by
y1=5(3x−4t)2+2 and y2=−5(3x+4t−6)2+2
The point where the two waves always cancel
View SolutionMany interesting wave phenomenon in nature cannot just be described by a single wave, instead one must analyze complex wave forms in terms of a combinations of many travelling waves. To analyze such wave combinations, we make use of the principle of superposition which states that if two or more travelling waves are moving through a medium and combine at a given point, the resultant displacement of the medium at that point is sum of the displacement of individual waves. Two pulses travelling on the same string are described by
y1=5(3x−4t)2+2 and y2=−5(3x+4t−6)2+2
The time when the two waves cancel everywhere
View SolutionA transverse harmonic wave on a string is described by y(x,t)=3.0sin(36t+0.018n+π/4), where x and y are in cm an t in sec. The positive direction of x is from left to right.
(a) Is this a travelling wave or a stationary wave?
(b) What are its amplitude and frequency?
View SolutionA standing wave pattern of maximum amplitude 2 mm is obtained in a string whose shape at t = 0 is represented in the graph.

If the speed of the travelling wave in the string is 5 cm/s, then find the component waves.
View Solution
