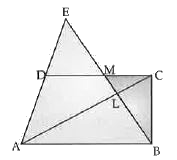
In the figure ⌊D=⌊EandADDB=AEEC. Prove that BAC is an isosceles triangle.
 Solution in Kannada
Step by step video & image solution for In the figure lfloorD=lfloorEand(AD)/(DB)=(AE)/(EC). Prove that BAC is an isosceles triangle. by Maths experts to help you in doubts & scoring excellent marks in Class 10 exams.
Updated on:21/07/2023Topper's Solved these Questions
- TRIANGLESBOOK - ZEN PUBLICATIONCHAPTER - TRIANGLESEXERCISE - ZEE ADDITIONAL QUESTIONS - SHORT ANSWER TYPE - 2 QUESTIONS
7 Videos
- TRIANGLESBOOK - ZEN PUBLICATIONCHAPTER - TRIANGLESEXERCISE - ZEE ADDITIONAL QUESTIONS - LONG ANSWER TYPE QUESTIONS
10 Videos
- TRIANGLESBOOK - ZEN PUBLICATIONCHAPTER - TRIANGLESEXERCISE - ZEE ADDITIONAL QUESTIONS - VERY SHORT ANSWER QUESTIONS
10 Videos
- SURFACE AREAS AND VOLUMESBOOK - ZEN PUBLICATIONCHAPTER - SURFACE AREAS AND VOLUMESEXERCISE - ZEE ADDITIONAL QUESTIONS -HOTS [HIGHER ORDER THINKING SKILLS]-QUESTIONS
11 Videos
Similar Questions
Prove that if the area of similar triangles are equal, they are congruent.
View SolutionThrought the mid-point M of the sides of a parallelogram ABCD, the line BM is drawn intersecting AC at L, and AD produced to E. Prove that EL=2BL.

View SolutionIn ΔABC, D and E are points on AB and AC respectively, such that DE∣∣BC. If ADDB=413 and AC = 20.4 cm, find AE.
View SolutionA sector of a circular is of radius 12 cm and angle 120∘. It is rolled up so that two bounding radii are joined together to form a cone. Find the volume of the cone.
View SolutionHow many lines of symmetry does the above figure have ?
View SolutionDetermine the point of symmetry of a regular hexagon.
View SolutionDtermine the images of the following figure about the given line :
View SolutionMatch the following Column A to Column B

View SolutionMatch the following Column A to Column B

View SolutionMatch the following Column A to Column B

View SolutionFind the area of the figure given below.

View SolutionThe area of the shaded part in the figure given below is ______.

View SolutionThe inequation represented by the graph given below is :
View SolutionThe inequation that best describes the graph given below is _________
View SolutionThe inequation that best describes the following graph is _________
View SolutionWhich inequations represent the shaded region in the given figure
View Solution
