In a test in Mathematics, 20% of the students obtained ''first class''. If the data are represented by a Pie - chart, what is the central angle corresponding to ''first class''?
20∘
36∘
72∘
144∘
The correct Answer is:C
Central angle =20% of 360%
=20×60100
=72∘
Topper's Solved these Questions
- SETS, RELATIONS, FUNCTIONS AND NUMBER SYSTEM BOOK - NDA PREVIOUS YEARSCHAPTER - SETS, RELATIONS, FUNCTIONS AND NUMBER SYSTEM EXERCISE - MCQ
271 Videos
- TRIGONOMETRY - RATIO & IDENTITY , TRIGONOMETRIC EQUATIONSBOOK - NDA PREVIOUS YEARSCHAPTER - TRIGONOMETRY - RATIO & IDENTITY , TRIGONOMETRIC EQUATIONSEXERCISE - MCQ
238 Videos
Similar Questions
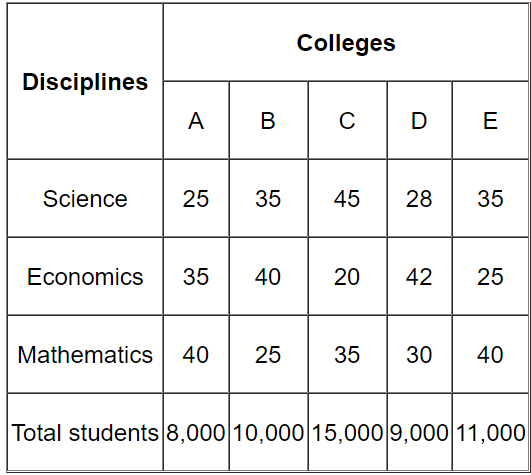
IF the data of the total students college wise, is represented by a pie chart, what is the central angle of the sector representing college E.
View SolutionStudy the given histogram that shows the marks obtained by students in an examination and examination and answer the question that follows .
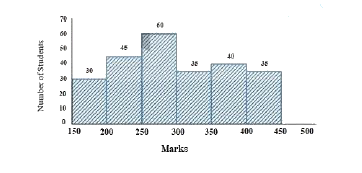
If the total marks obtained by students be represented as a pie chart ,then the central angle corresponding to marks 250 or more but less than 300 is :
(correct to the nearest degree)
View Solution
Knowledge Check
In a test in Mathematics 20% of the students obtained first class If the data are represented by a Pie Chart, what is the central angle corresponding to "first class''?
(a)20∘
(b)36∘
(c)72∘
(d)144∘A20∘B36∘C72∘D144∘In an examination, 40% of candidates got second class. When the data are represented by a pie chart, what is the angle corresponding to second class?
(a)40∘
(b)90∘
(c)144∘
(d)320∘A40∘B90∘C144∘D320∘In an examination, 40% of candidates got second class. When the data are represented by a pie chart, what is the angle corresponding to second class?
A40∘B90∘C144∘D320∘
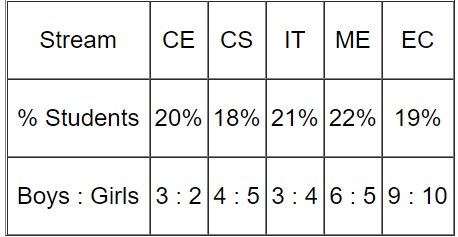
IF the data about the number of girls enrolled in the various streams is represented by a pie chart, what is the central angle of the sector representing the number of girls in the ME stream, to the nearest whole degree.
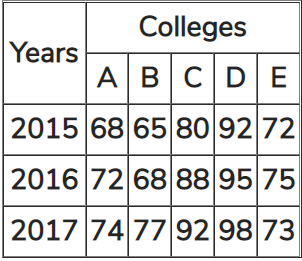
View SolutionIF the number of passed out students of all five college is represented by a pie chart. What is the central angle of the sector representing the passed out students of college C?
View SolutionThe table shows the production of different types of cars (in thousands).
 In the data related to the production of type D cars in represented by a pie chart, then the central angle of the sector representing production of cars in 2015 will be:
यदि D प्रकार की कारों से संबंधित आंकड़ों को एक पाई-चार्ट में प्रस्तुत किया जाए, तो 2015 में कारों के उत्पादन को दर्शाने वाले खंड का केंद्रीय कोण होगा :
View SolutionThe table shows the production of different types of cars (in thousands).
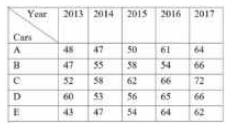
If the data related to the production of type D cars is represented by a pie chart, then the central angle of the sector representing the production of cars in 2016 will be:
View SolutionIF the data about students of the commerce stream in all colleges is represented by a pie chart. What is the central angle of the sector representing college D, to the nearest degree
View Solution
