IF the data about students of the commerce stream in all colleges is represented by a pie chart. What is the central angle of the sector representing college D, to the nearest degree
The correct Answer is:D
To find the central angle of the sector representing College D in a pie chart, follow these steps:
1. Identify the Total Number of Students:
- From the problem, we have the number of students in different colleges:
- College A: 400
- College B: 900
- College C: 325
- College D: 275
- Calculate the total number of students:
Total=400+900+325+275=1900
2. Determine the Number of Students in College D:
- The number of students in College D is given as 275.
3. Calculate the Central Angle for College D:
- The formula to find the central angle for a sector in a pie chart is:
Central Angle=(Number of Students in College DTotal Number of Students)×360∘
- Plugging in the values:
Central Angle=(2751900)×360
4. Simplify the Calculation:
- First, calculate 2751900:
2751900=0.1447368421(approximately)
- Now multiply by 360:
0.1447368421×360≈52.7
5. Round to the Nearest Degree:
- Rounding 52.7 gives us 53 degrees.
6. Final Answer:
- The central angle of the sector representing College D is approximately 53 degrees.
- From the problem, we have the number of students in different colleges:
- College A: 400
- College B: 900
- College C: 325
- College D: 275
- Calculate the total number of students:
Total=400+900+325+275=1900
- The number of students in College D is given as 275.
- The formula to find the central angle for a sector in a pie chart is:
Central Angle=(Number of Students in College DTotal Number of Students)×360∘
- Plugging in the values:
Central Angle=(2751900)×360
- First, calculate 2751900:
2751900=0.1447368421(approximately)
- Now multiply by 360:
0.1447368421×360≈52.7
- Rounding 52.7 gives us 53 degrees.
- The central angle of the sector representing College D is approximately 53 degrees.
Topper's Solved these Questions
Similar Questions
The following table shows the percentage distribution of students in various disciplines from five different colleges.
निम्नलेखित तालिका पांच अलग-अलग कॉलेजों के विभिन्न विषयों में छात्रों का प्रतिशत वितरण दर्शाती है |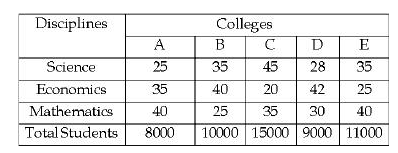 If the data of the total students’ college wise, is represented by a pie-chart, what is the central
angle of the sector representing college E (to nearest whole number)?
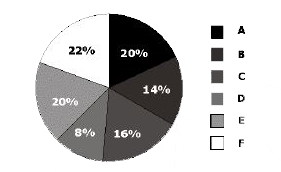
यदि कॉलेज वार कुल छात्रों के आंकड़ों को एक पाई-चार्ट में प्रस्तुत किया जाए, तो कॉलेज E को दर्शन वाले खंड का केंद्रीय कोण क्या होगा ? ( निकटतम पूर्ण संख्या में )View SolutionIn the given pie chart what is the central angle of the sector representing the number of employees in the department D?
 View Solution
Knowledge Check
- Question 1 - Select One
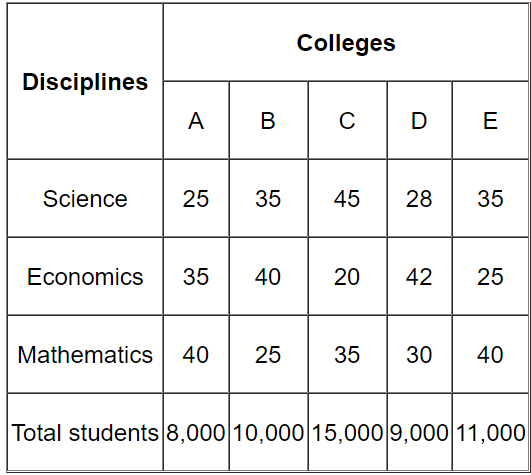
IF the data of the total students college wise, is represented by a pie chart, what is the central angle of the sector representing college E.
 A78∘B75∘C79∘D73∘
 - Question 2 - Select One
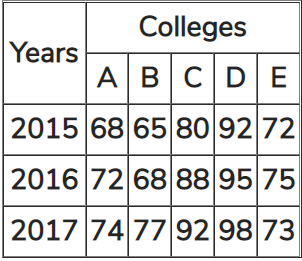
IF the number of passed out students of all five college is represented by a pie chart. What is the central angle of the sector representing the passed out students of college C?
 A69∘B79∘C77∘D67∘
 - Question 3 - Select One
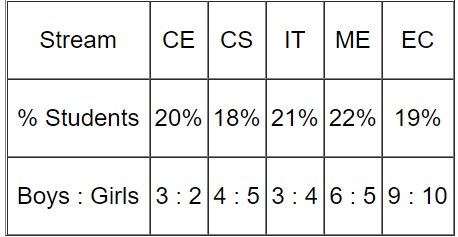
IF the data about the number of girls enrolled in the various streams is represented by a pie chart, what is the central angle of the sector representing the number of girls in the ME stream, to the nearest whole degree.
 A68∘B70∘C72∘D74∘
The table below indicates the percentage of students and the ratio of boys and girls in the various streams of a college. (Total students = 2600)
नीचे दी गयी तालिका छात्रों का प्रतिशत तथा कॉलेज के विभिन्न विषयों में लड़कों तथा लड़कियों का अनुपात दर्शाती है | ( कुल छात्र = 2600 ) If the data about the number of girls enrolled in the various streams is represented by a pie-chart, what is the central angle of the sector representing the number of girls in the ME stream, to the nearest whole degree?
यदि विभिन्न विषयों में नामांकन लेने वाली लड़कियों की संख्या से संबंधित आंकड़ों को एक पाई-चार्ट के द्वारा दर्शाया जाए, तो ME विषय में लड़कियों की संख्या को दर्शाने वाले खंड का केंद्रीय कोण ( निकटतम पूर्ण डिग्री में ) क्या होगा ?View Solution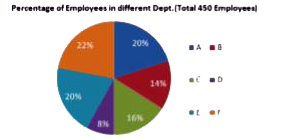
In the given pie-chart, what is the central angle of the sector representing the number of employees in the department D?View SolutionThe table shows the production of different types of cars (in thousands).
यह तालिका एक कंपनी द्वारा अलग-अलग कारों के उत्पादन (हज़ार में ) को दर्शाती है |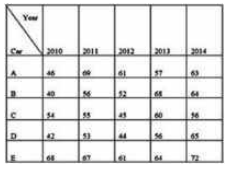 If the data related to the production of type C cars is represented by a pie-chart, then the central angle of the sector representing production of cars in 2012 will be:
यदि C प्रकार की कारों के उत्पादन से संबंधित आंकड़ों को एक पाई-चार्ट में प्रस्तुत किया जाए, तो 2012 में कारों के उत्पादन को दर्शाने वाले खंड का केंद्रीय कोण होगा :View SolutionThe table shows the production of different types of cars (in thousands).
 In the data related to the production of type D cars in represented by a pie chart, then the central angle of the sector representing production of cars in 2015 will be:
यदि D प्रकार की कारों से संबंधित आंकड़ों को एक पाई-चार्ट में प्रस्तुत किया जाए, तो 2015 में कारों के उत्पादन को दर्शाने वाले खंड का केंद्रीय कोण होगा :View SolutionThe table shows the production of different types of cars (in thousands).
यह तालिका एक कंपनी द्वारा 5 वर्षों में अलग-अलग कारों के उत्पादन (हज़ार में ) को दर्शाती है | If the data related to the production of type D cars is represented by a pie chart, then the central angle of the sector representing the production of
cars in 2013 will be:
यदि D प्रकार की कारों के उत्पादन से संबंधित आंकड़ों को एक पाई-चार्ट में प्रस्तुत किया जाए, तो 2013 में कारों के उत्पादन को दर्शाने वाले खंड का केंद्रीय कोण होगा :View Solution

