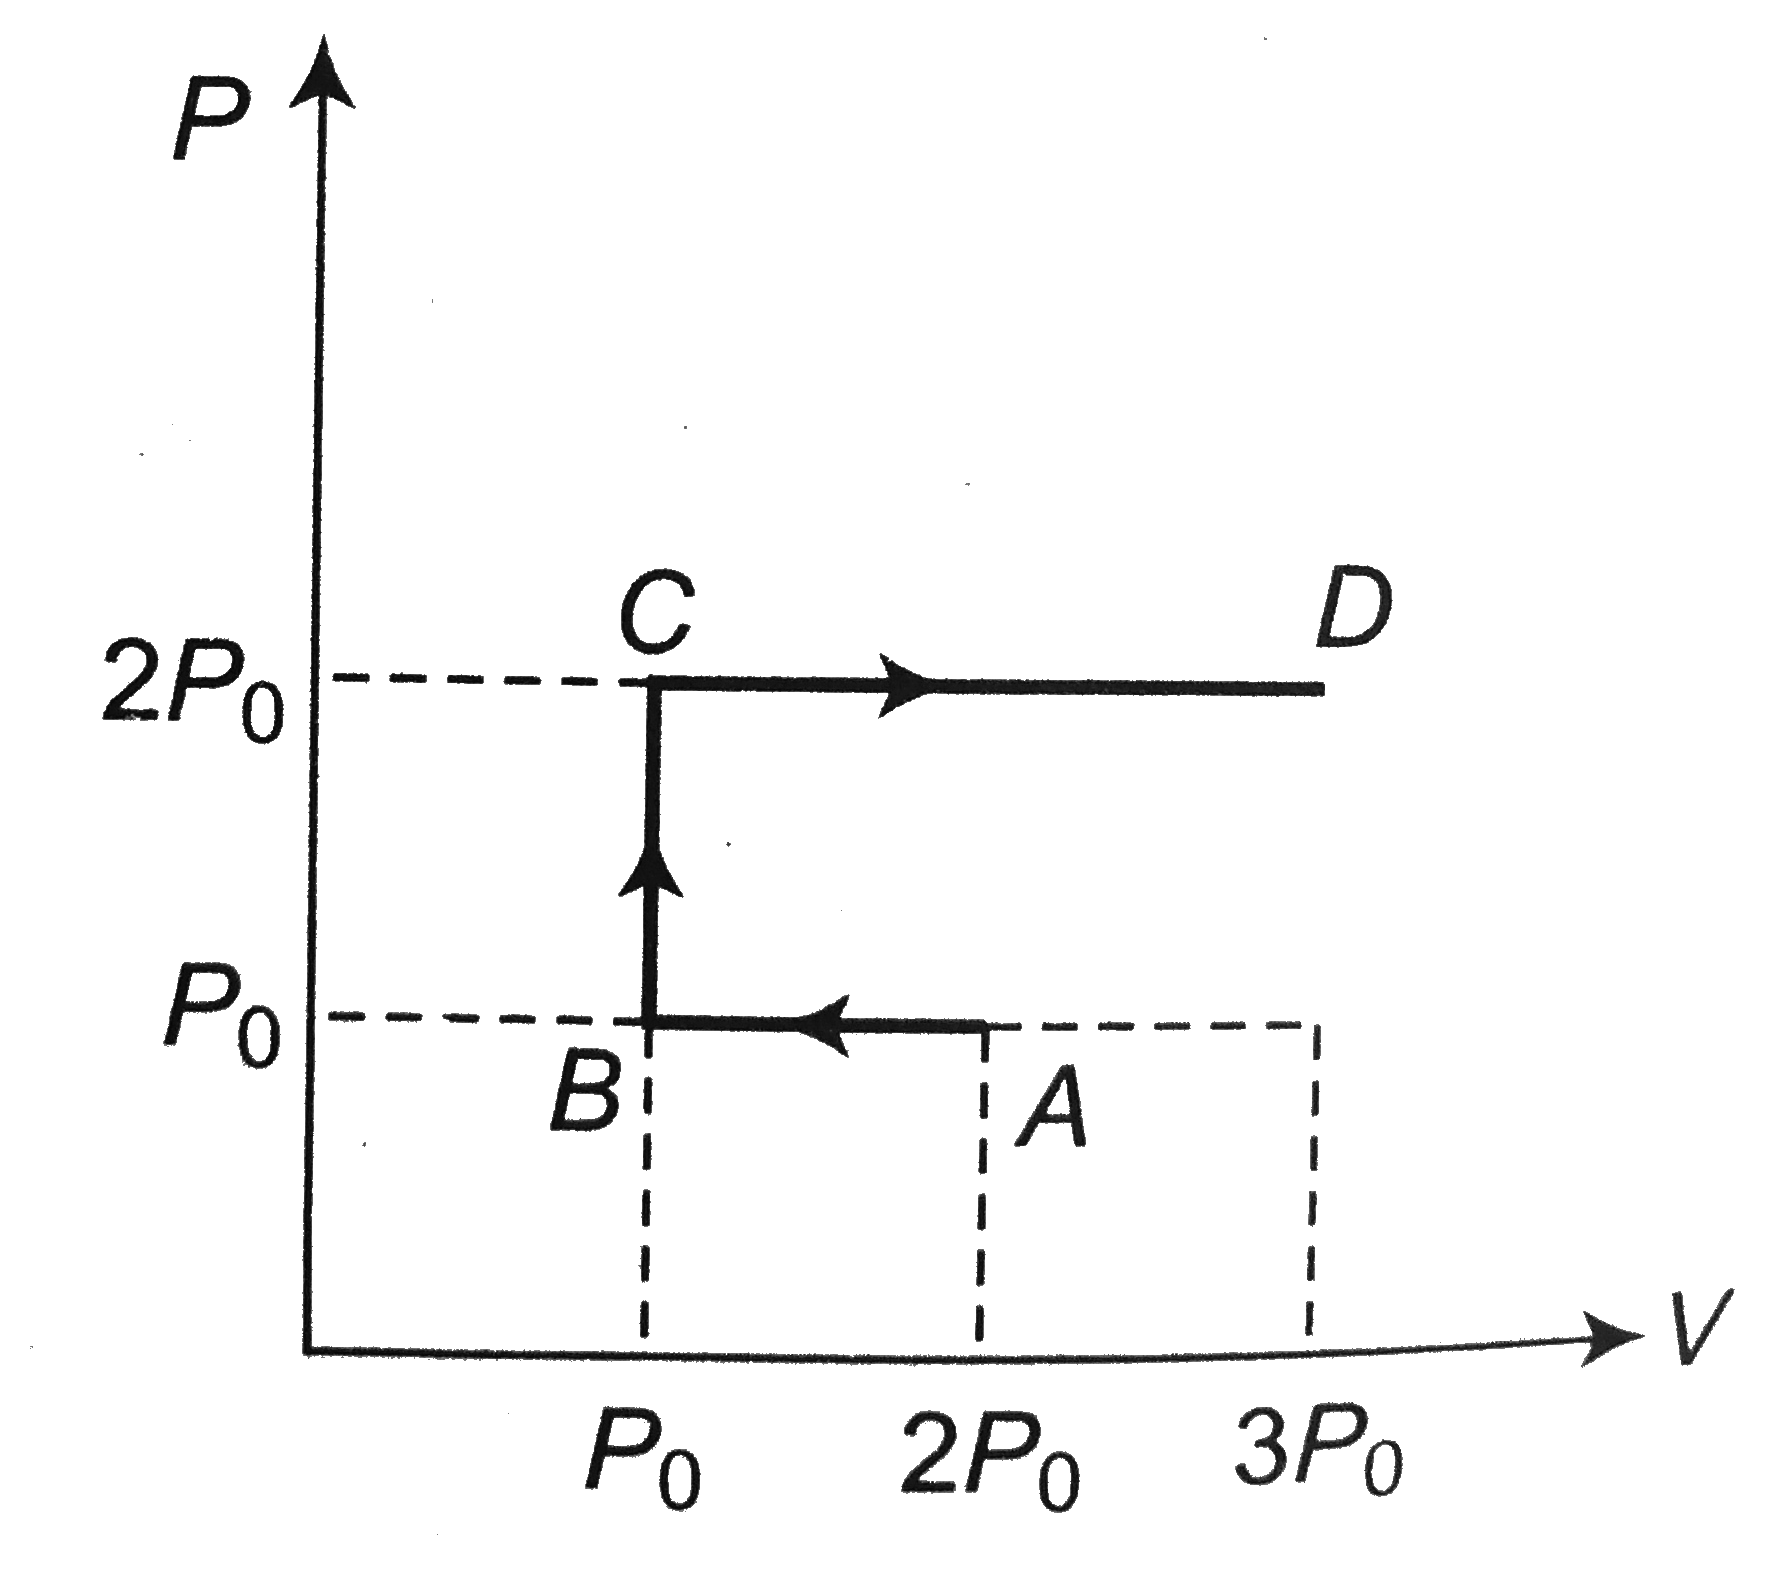
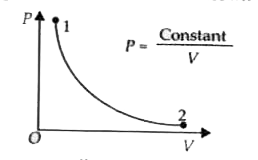
Consider P → V diagram for an ideal gas shown in figure.

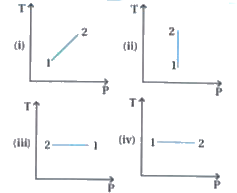
Out of the following diagrams which figure, represents the T → P diagram ?
 Solution in Gujrati
(iv)
(ii)
(iii)
(i)
The correct Answer is:C

PV = constant, so process is isothermal, hence volume decreases and pressure increases and when volume increases, pressure decreases and if temperature remains constant, volume increases when pressure decreases. This is corresponds to diagram (iii) option (C).
Topper's Solved these Questions
- THERMODYANMICS BOOK - KUMAR PRAKASHANCHAPTER - THERMODYANMICS EXERCISE - Section-D Ncert Exemplar Solution (MCQs More than one option )
5 Videos
- THERMODYANMICS BOOK - KUMAR PRAKASHANCHAPTER - THERMODYANMICS EXERCISE - Section-D Ncert Exemplar Solution (Very Short Answer )
5 Videos
- THERMODYANMICS BOOK - KUMAR PRAKASHANCHAPTER - THERMODYANMICS EXERCISE - Section-C (Objective Questions (Assertion & Reason )
8 Videos
- THERMAL PROPERTIES OF MATTERBOOK - KUMAR PRAKASHANCHAPTER - THERMAL PROPERTIES OF MATTEREXERCISE - Question Paper (Section - D) (Answer following in brief :) Each carry 4 marks
1 Videos
- UNITS AND MEASUREMENTBOOK - KUMAR PRAKASHANCHAPTER - UNITS AND MEASUREMENTEXERCISE - Section -F (Questions from Module )
20 Videos
Similar Questions
Which of the processes described below are irreversible ?
View SolutionCan a system be heated and its temperature remains constant ?
View SolutionAssertion : Work and heat are two equivalent form of energy
Reason: Work is the transfer of mechanical energy irrespective of temperature difference, whereas heat is the transfer of thermal energy because of temperature difference only.
View SolutionIn an experiment on the specific heat of a metal, a 0.20 kg block of the metal at 150∘C is dropped in a copper calorimeter (of water equivalent 0.025 kg) containing 150 cm3 of water at 27∘C. The final temperature is 40∘C. Compute the specific heat of the metal. If heat losses to the surroundings are not negligible, is your answer greater or smaller than the actual value for specific heat of the metal ?
View SolutionIf the error in measurement of radius of a shpere is 2% then the error in determination of volume of the sphere will be …………
View SolutionP−V diagram of an ideal gas is as shown in figure. Work done by the gas in process ABCD is
View SolutionConsider P-V diagram for an ideal gas shown in figure. Out of following diagrams(figure). Which represents the T-P diagram?
View SolutionAn ideal gas underoges cyclic process of ABCDA as shown in Given P−V diagram (figure)
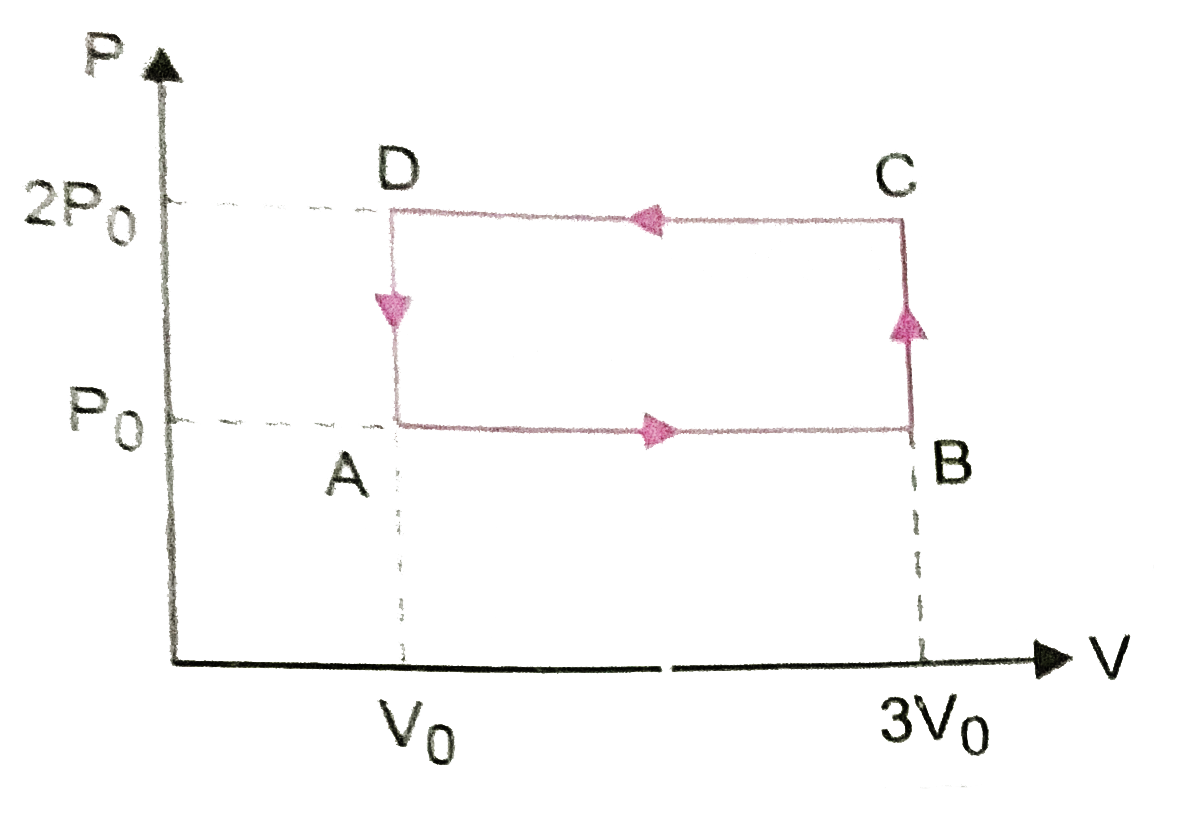
The amount of work done by the gas is
View Solution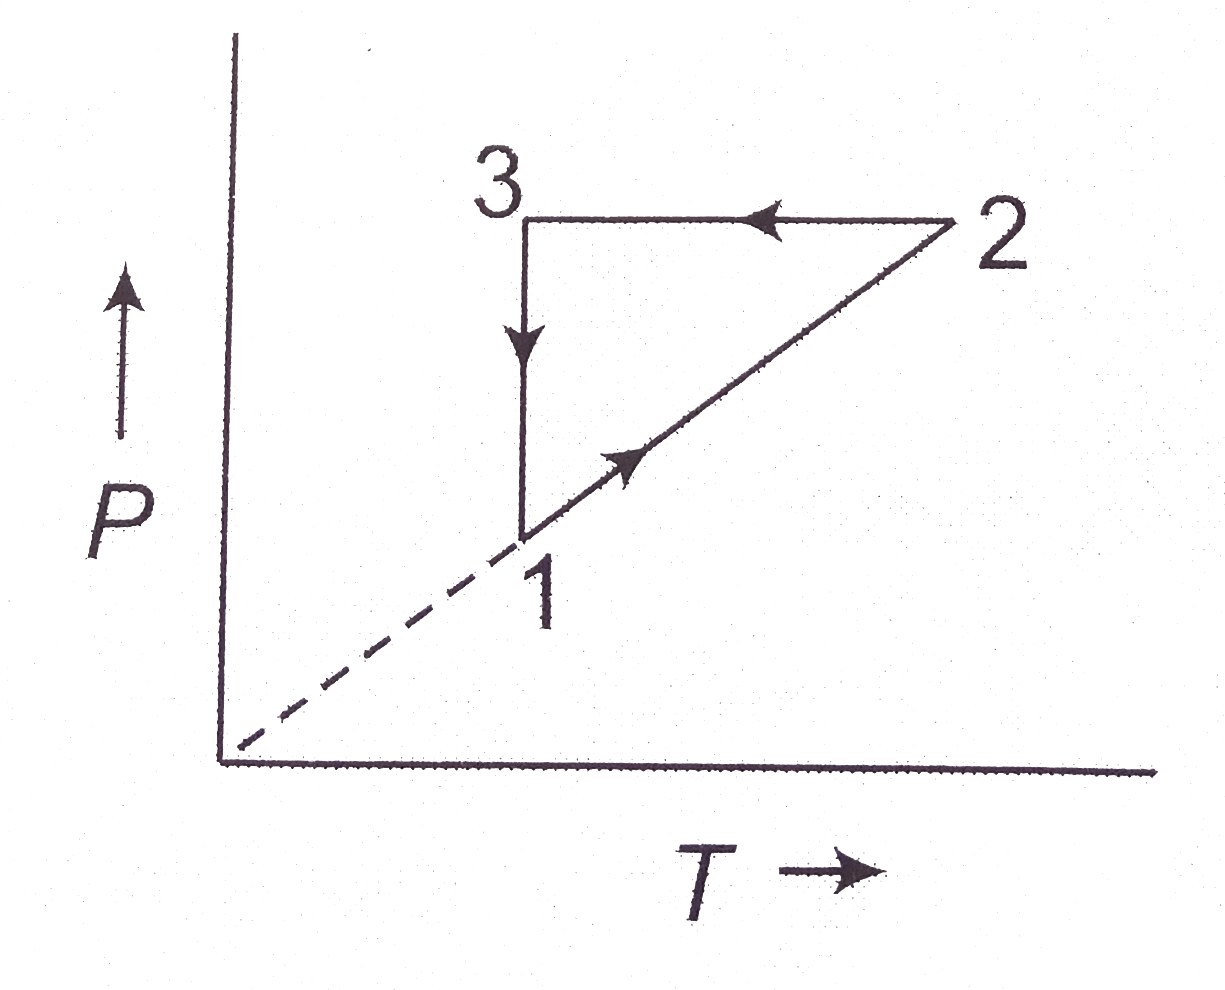
A cyclic process 1→2→3→1 shown in P−T diagram is performed with a constant mass of an ideal gas. Show it on a (a) P−V diagram (b) V−T
View SolutionConsider p - V diagram for an ideal gas shown in figure. Out of the following diagrams, which figure represents the T-p diagram ? (i)
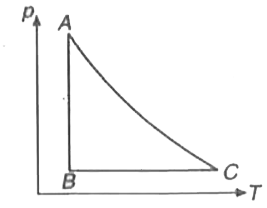
View Solutionएक आदर्श गैस के लिए p - T आरेख चित्रानुसार है, AC रुद्धोष्म प्रक्रम है, तदानुसार p - V आरेख होगा
View SolutionP-V diagram of an ideal gas is as shown in figure. Work done by the gas in the process ABCD is
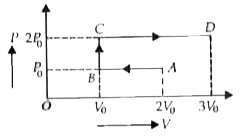
View SolutionThe P-V diagram for an ideal gas is shown in figure.
Out of the following diagrams which one represents the T-P diagram ?
View SolutionConsider p-V diagram for an ideal gas shown in figure.
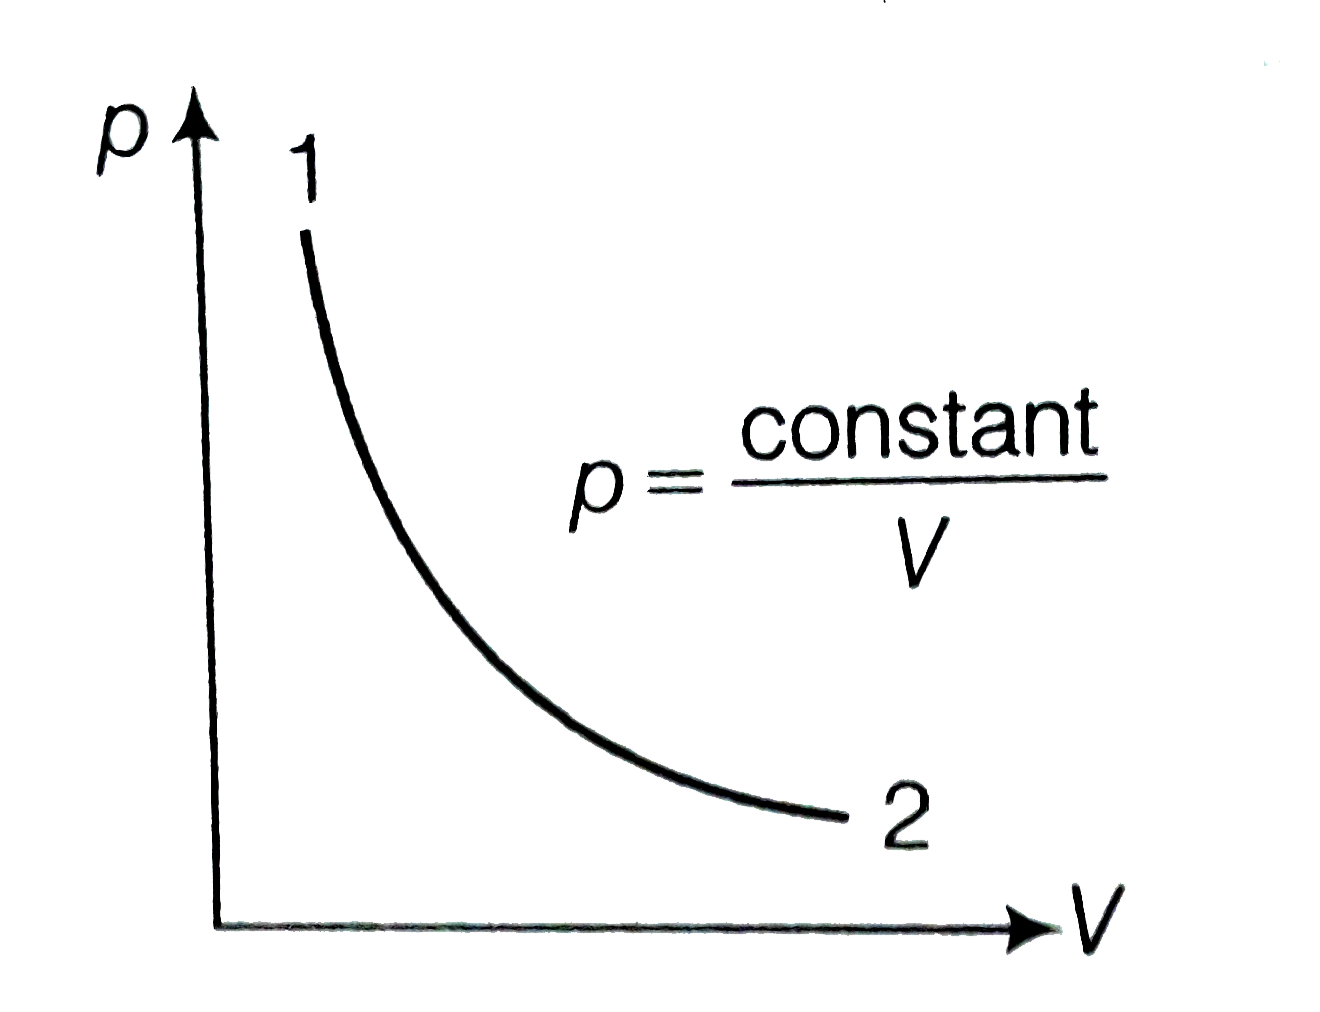
Out of the following diagrams, which figure represents the T−p diagram ?
(i)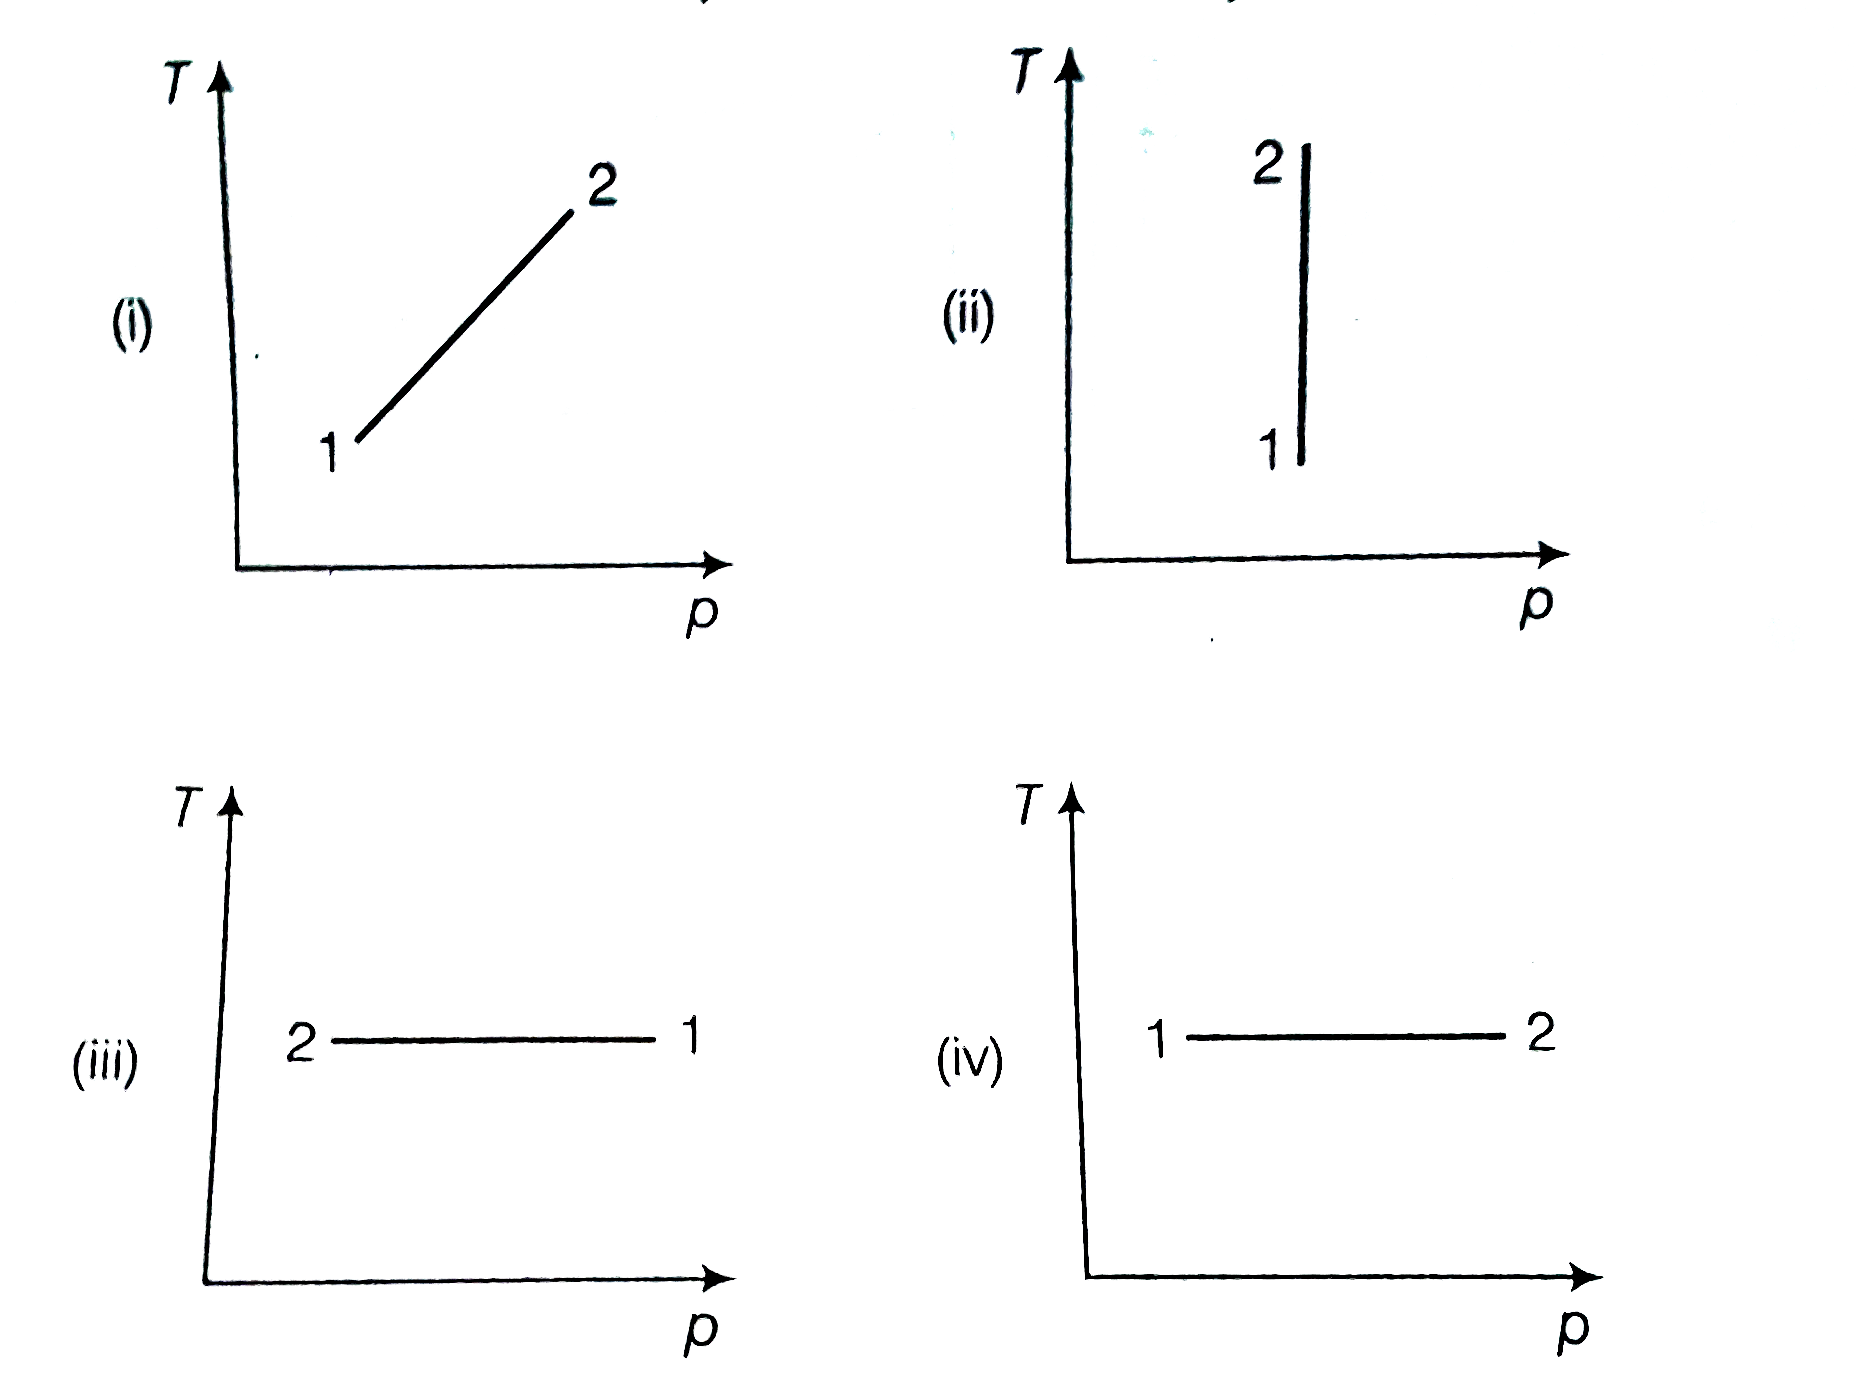
View SolutionA cyclic process ABCA shown in the V-T diagram is performed with a constant mass of an ideal gas. Show the same process on a p-V diagram, In the figure, CA is parallel to the V-axis and BC is parallel to the T-axis.
View Solution
