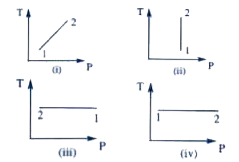
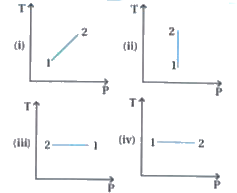
Consider P-V diagram for an ideal gas shown in Fig 12.2. Out of the following diagrams which represents the T-P diagram ? 
 Solution in Telugu
(iv)
(ii)
(iii)
(i)
The correct Answer is:C
Step by step video, text & image solution for Consider P-V diagram for an ideal gas shown in Fig 12.2. Out of the following diagrams which represents the T-P diagram ? by Physics experts to help you in doubts & scoring excellent marks in Class 11 exams.
Topper's Solved these Questions
- BOOK - AAKASH SERIESCHAPTER - THERMODYNAMICSEXERCISE - EXERCISE - 1B32videos
THERMODYNAMICS
- BOOK - AAKASH SERIESCHAPTER - THERMODYNAMICSEXERCISE - EXERCISE - 258videos
THERMODYNAMICS
- BOOK - AAKASH SERIESCHAPTER - THERMODYNAMICSEXERCISE - Problem60videos
THERMODYNAMICS
- BOOK - AAKASH SERIESCHAPTER - THERMAL PROPERTIES OF MATTEREXERCISE - ADDITIONAL PRACTICE EXERCISE (LEVEL - II) PRACTICE SHEET (ADVANCED) Integer/Subjective Type Questions2videos
THERMAL PROPERTIES OF MATTER
- BOOK - AAKASH SERIESCHAPTER - THERMOMETRY EXERCISE - Numerical Exercise (LEVEL- 1)11videos
THERMOMETRY
Similar Questions
Assertion (A) & Reason (R ) Type Questions
(A): During a free expansion of an ideal gas workdone is zero
(R): Workdone against vacuum is zero03:00View SolutionHow much steam at 100∘C is to be passed into water of mass 100g at 20∘c to raise its temperature by 5∘C ? (Latent heat of steam is 540 cal /g and specific heat of water is 1cal/g∘C)
01:53View SolutionHailstones fall from a certain height. If they melt completely on reaching the ground, find the height from which they fall.
02:03View SolutionA constant pressure gas thermometer has a volume of 200cc, 273.2cc and 525 .1cc at 0°C, 100°C and boiling point of sulphur respectively. The resistance possessed by a platinum wire at the same temperatures as above are 2.000Ω,2.778Ωand5.280Ω respectively. Estimate the boiling point of sulphur on the basis of the two sets of observations.
View SolutionIf a temperature scale defines the freezing point of water as 100∘C and the boiling as 0∘ what temperature on the scale corresponds to 25∘ C ?
01:08View SolutionA Cycle process ABCA shown in V-T diagram Fig. is preformed with a constant mass of an ideal gas. Show the same process on a P-V diagram.
03:27View SolutionP - T diagram is shown in Fig. Choose the corresponding V - T diagram.
05:13View SolutionConsider P-V diagram for an ideal gas shown in figure. Out of following diagrams(figure). Which represents the T-P diagram?
03:39View Solution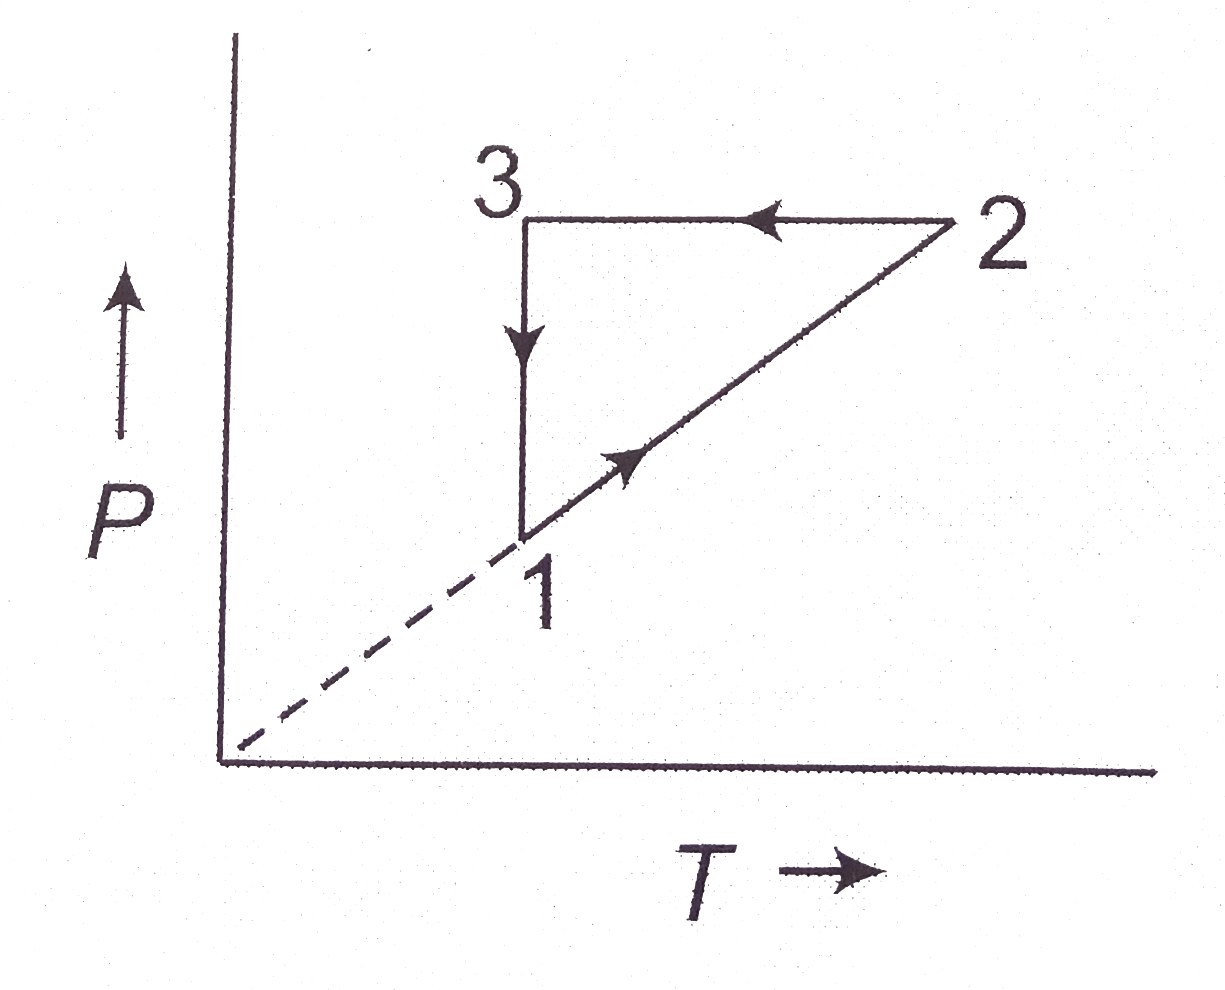
A cyclic process 1→2→3→1 shown in P−T diagram is performed with a constant mass of an ideal gas. Show it on a (a) P−V diagram (b) V−T04:37View SolutionConsider p - V diagram for an ideal gas shown in figure. Out of the following diagrams, which figure represents the T-p diagram ? (i)
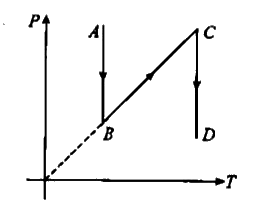
View SolutionP-T diagram is shown below then choose the corresponding V-T diagram
 01:48View Solution
A cyclic process is shown in the p – T diagram . Which of the following curves shows the same process on the p – V diagram ?
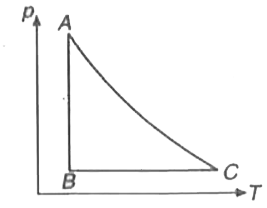
01:31View Solutionएक आदर्श गैस के लिए p - T आरेख चित्रानुसार है, AC रुद्धोष्म प्रक्रम है, तदानुसार p - V आरेख होगा
 01:52View Solution
Consider P → V diagram for an ideal gas shown in figure.

Out of the following diagrams which figure, represents the T → P diagram ?
 03:25View Solution
The P-V diagram for an ideal gas is shown in figure.
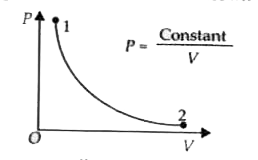
Out of the following diagrams which one represents the T-P diagram ?05:18View Solution

