The electric potential as a function of distance 'x' is shown in the figure . Draw a graph of the electric field E as a function of x.
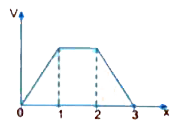
We know that electric field E=−dVdx . Hence the graph of the electric field E as a function of x will be as shown here .
Topper's Solved these Questions
- ELECTROSTATIC POTENTIAL AND CAPACITANCE BOOK - U-LIKE SERIESCHAPTER - ELECTROSTATIC POTENTIAL AND CAPACITANCE EXERCISE - SELF ASSESSMENT TEST
1 Videos
- ELECTROSTATIC POTENTIAL AND CAPACITANCE BOOK - U-LIKE SERIESCHAPTER - ELECTROSTATIC POTENTIAL AND CAPACITANCE EXERCISE - LONG ANSWER QUESTIONS-I
64 Videos
- ELECTROMAGNETICE INDUCTIONBOOK - U-LIKE SERIESCHAPTER - ELECTROMAGNETICE INDUCTIONEXERCISE - Self Assessment Test Section -D
1 Videos
- EXAMINATION PAPER 2020 (SOLVED)BOOK - U-LIKE SERIESCHAPTER - EXAMINATION PAPER 2020 (SOLVED)EXERCISE - SECTION D
6 Videos
Similar Questions
A graph of the x-component of the electric field as a function of x in a region of space is shown in the figure. They y and z-components of the electric field are zero in this region. The electric potential at the origin is 10 V. The value of x for which potential is zero is
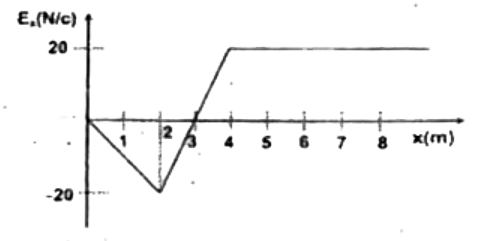
View SolutionA graph of the x-component of the electric field as a function of x in a region of space is shown in the figure.
They y and z-components of the electric field are zero in this region. The electric potential at the origin is 10 V.
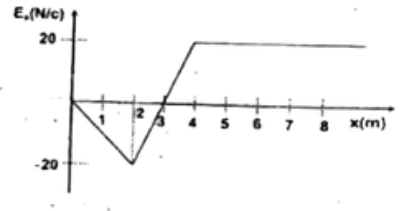
The greatest positive value of electric potential for points of the x-axis for which 0≤x≤6m is
View Solution
Knowledge Check
A graph of the x-component of the electric field as a function of x in a region of space is shown in figure. The y−andz−compo≠nts of the electric field are zero in this region. If the electric potential is 10 V at the origin, then the potential at x = 2.0 m is
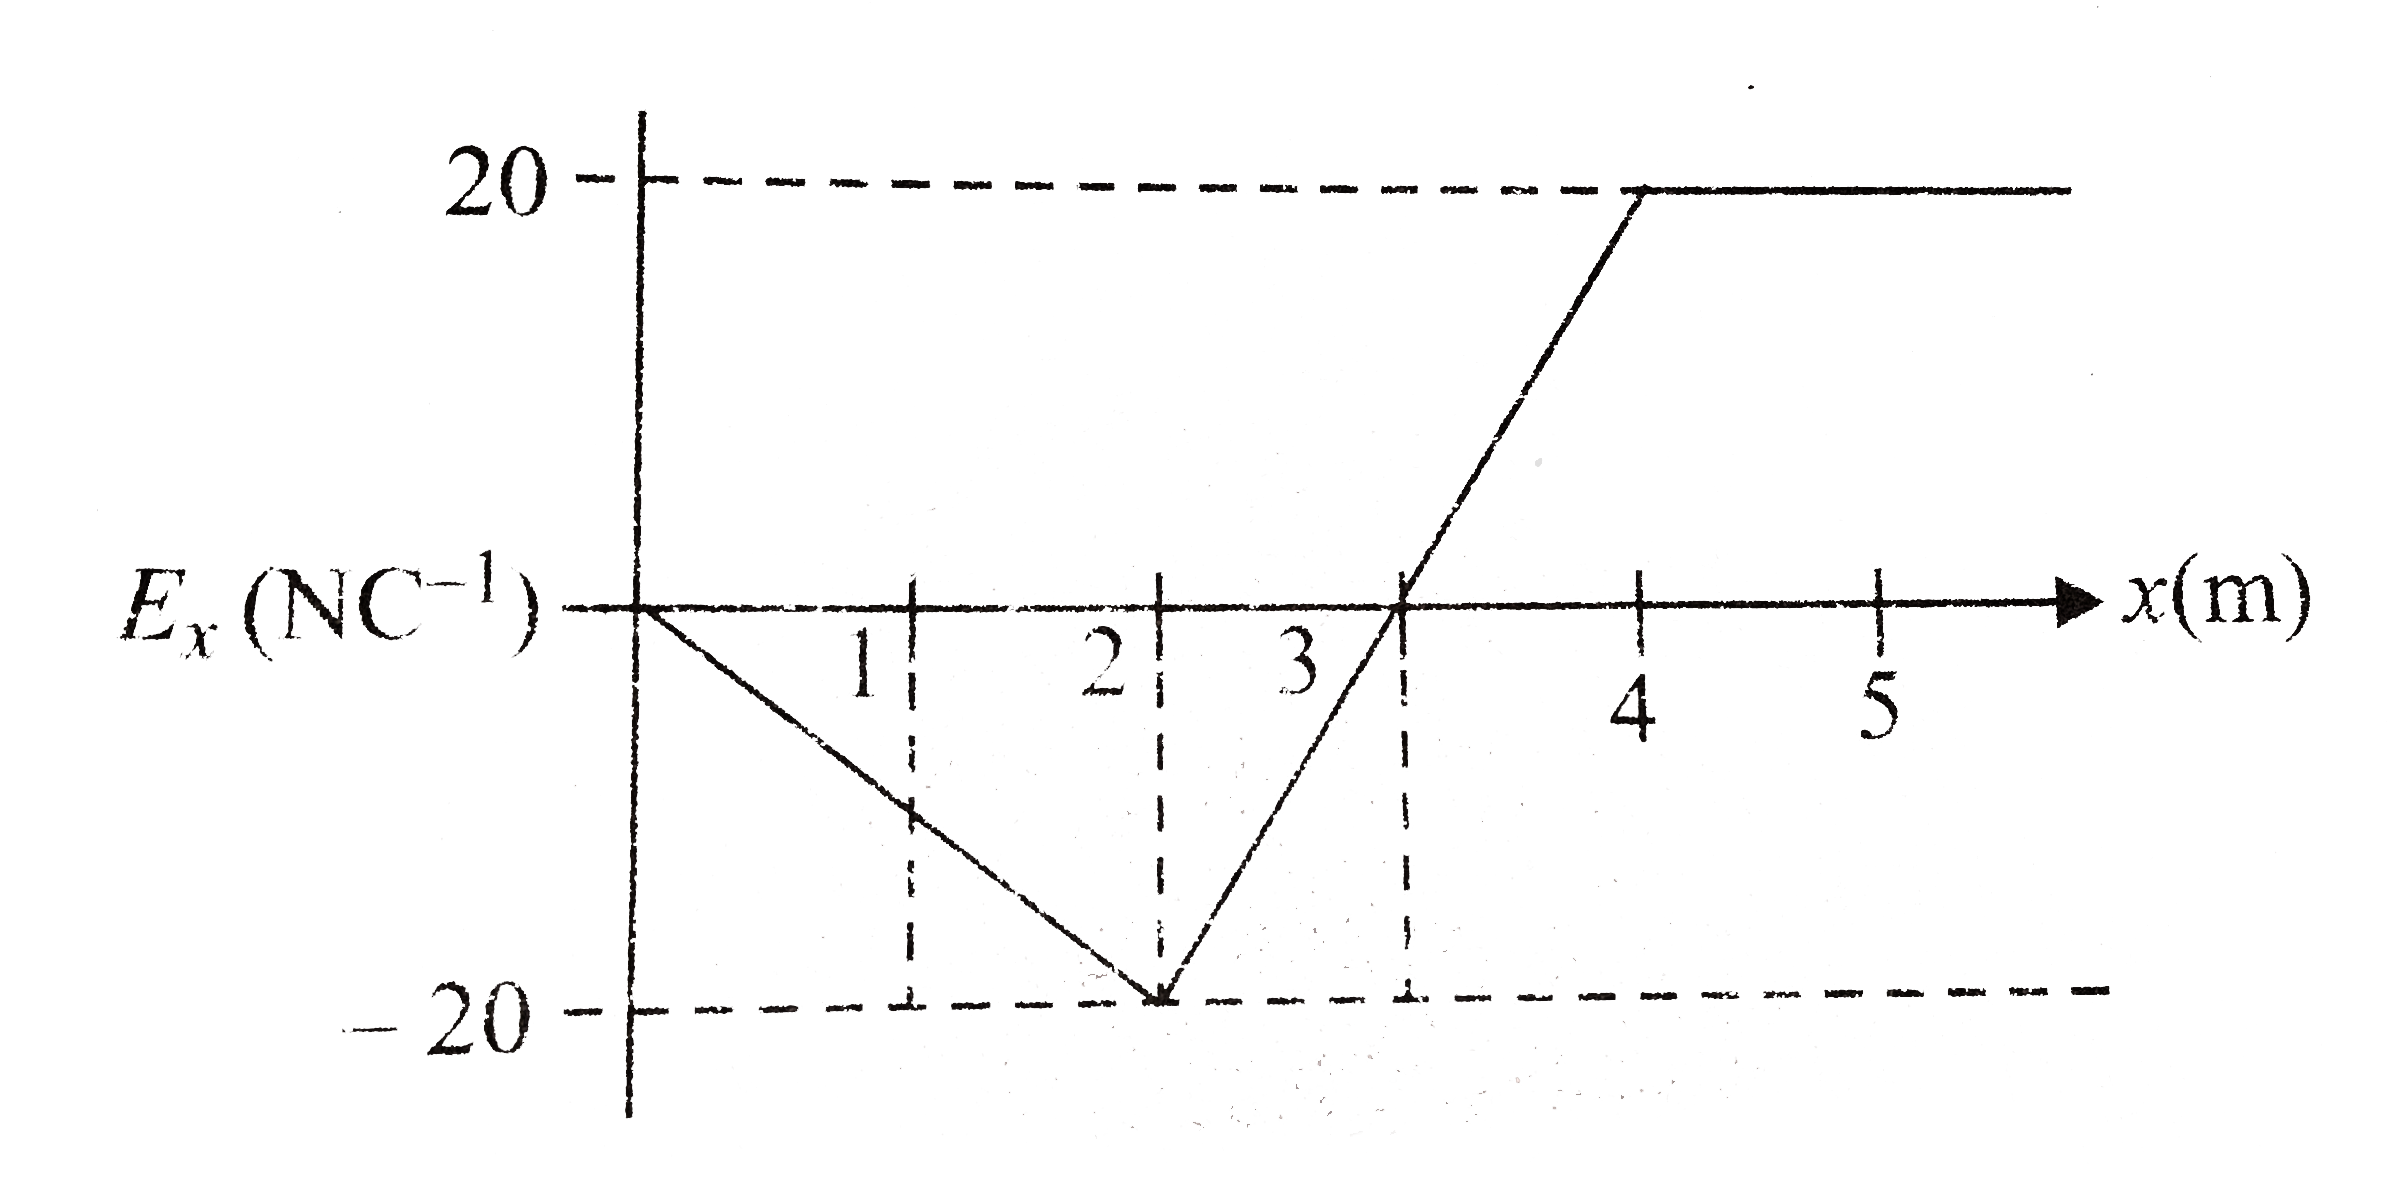 A10VB40VC−10VD30V
The figure gives the electric potential V as a function of distance through five regions on x-axis. Which of the following is true for the electric E in these regions ?
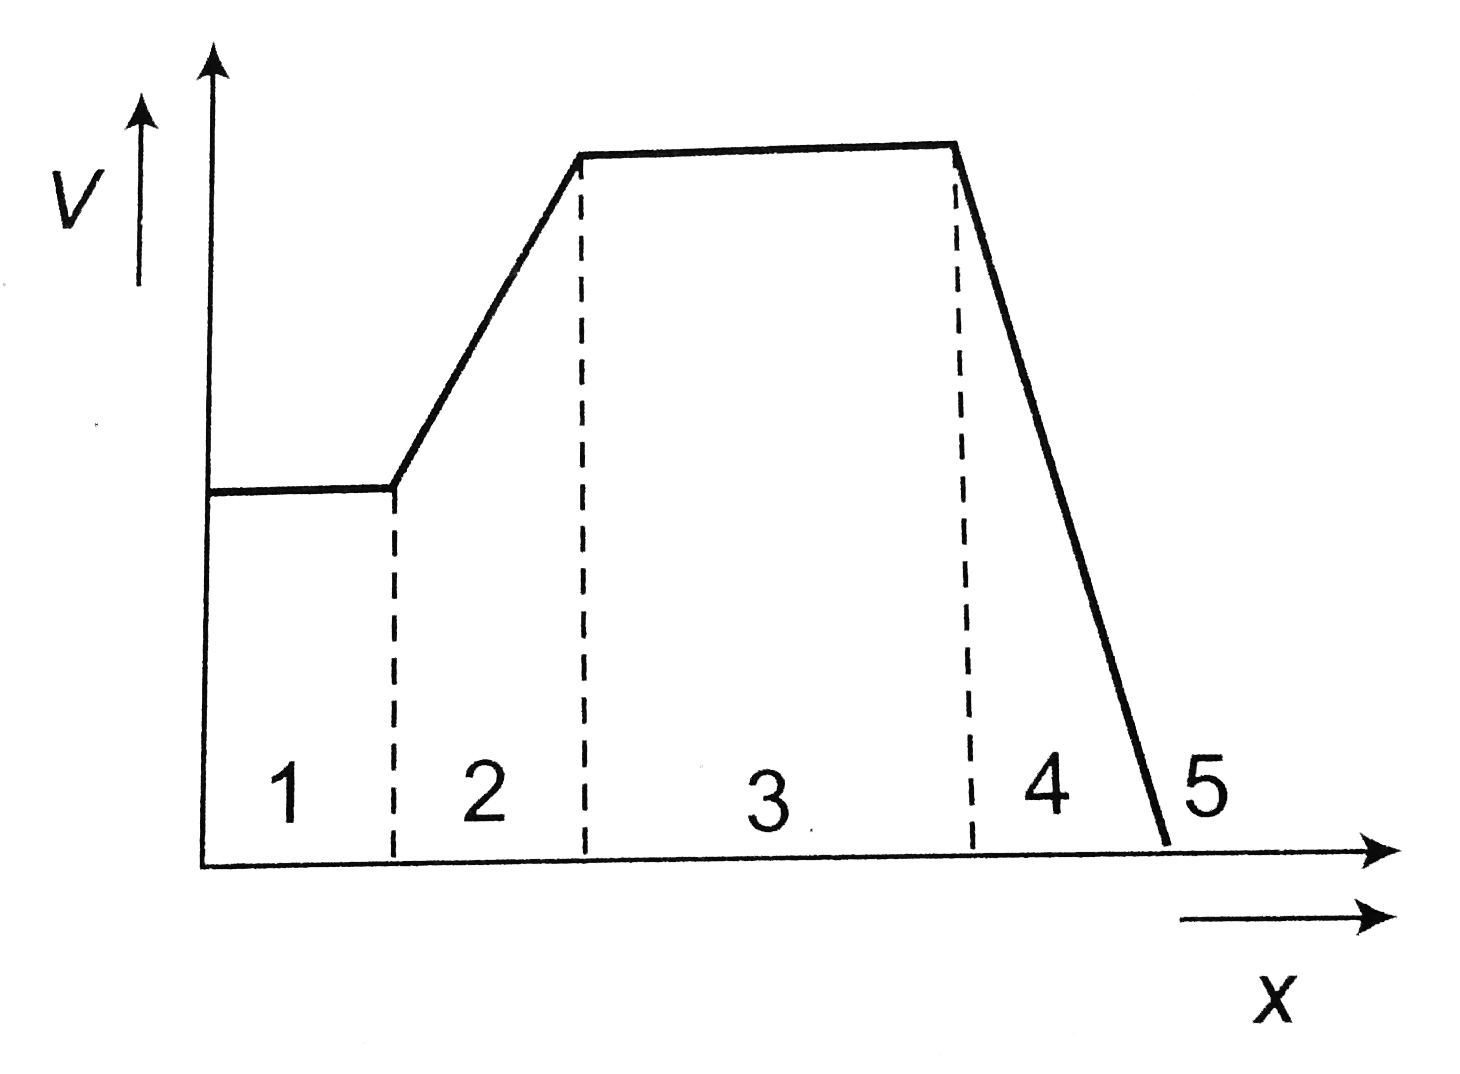 AE2=E4,E5=0andE3>E1BE1=E3,E5=0andE2<E4CE2=E4,E5=0andE1<E3DE1<E2<E3<E4<E5
The variation of electric potential with distance from a fixed point is shown in figure. What is the value of electric field at x=2m -
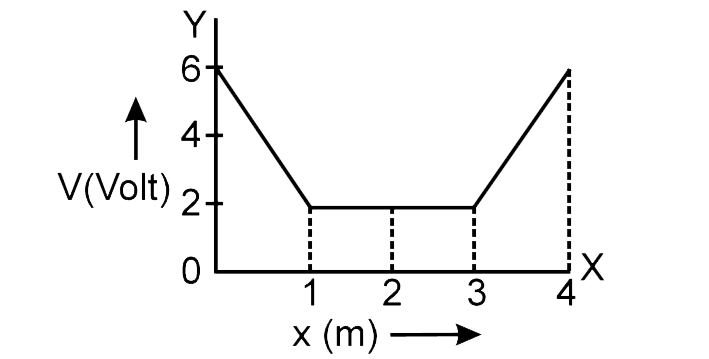 AZeroB6/2C6/1D6/3
A graph of the x-component of the electric field as a function of x in a region of space is shown in figure. The y−andz−compo≠nts of the electric field are zero in this region. If the electric potential is 10 V at the origin, then the potential at x = 2.0 m is

View SolutionDraw the graph of the function: 1−x
View SolutionThe figure gives the electric potential V as a function of distance through five regions on x-axis. Which of the following is true for the electric E in these regions ?

View SolutionThe electric potential V is givne as a function of distance x (metre) by V=(5x2+10x−9) volt. Value of electric field at x=1is
View SolutionIn an electric field region, the electric potential varies along the x-axis as shown in the graph. The x components of the electirc field in the regions for the intervals PQ and QR as market in the garph, in N/C, are respectively:
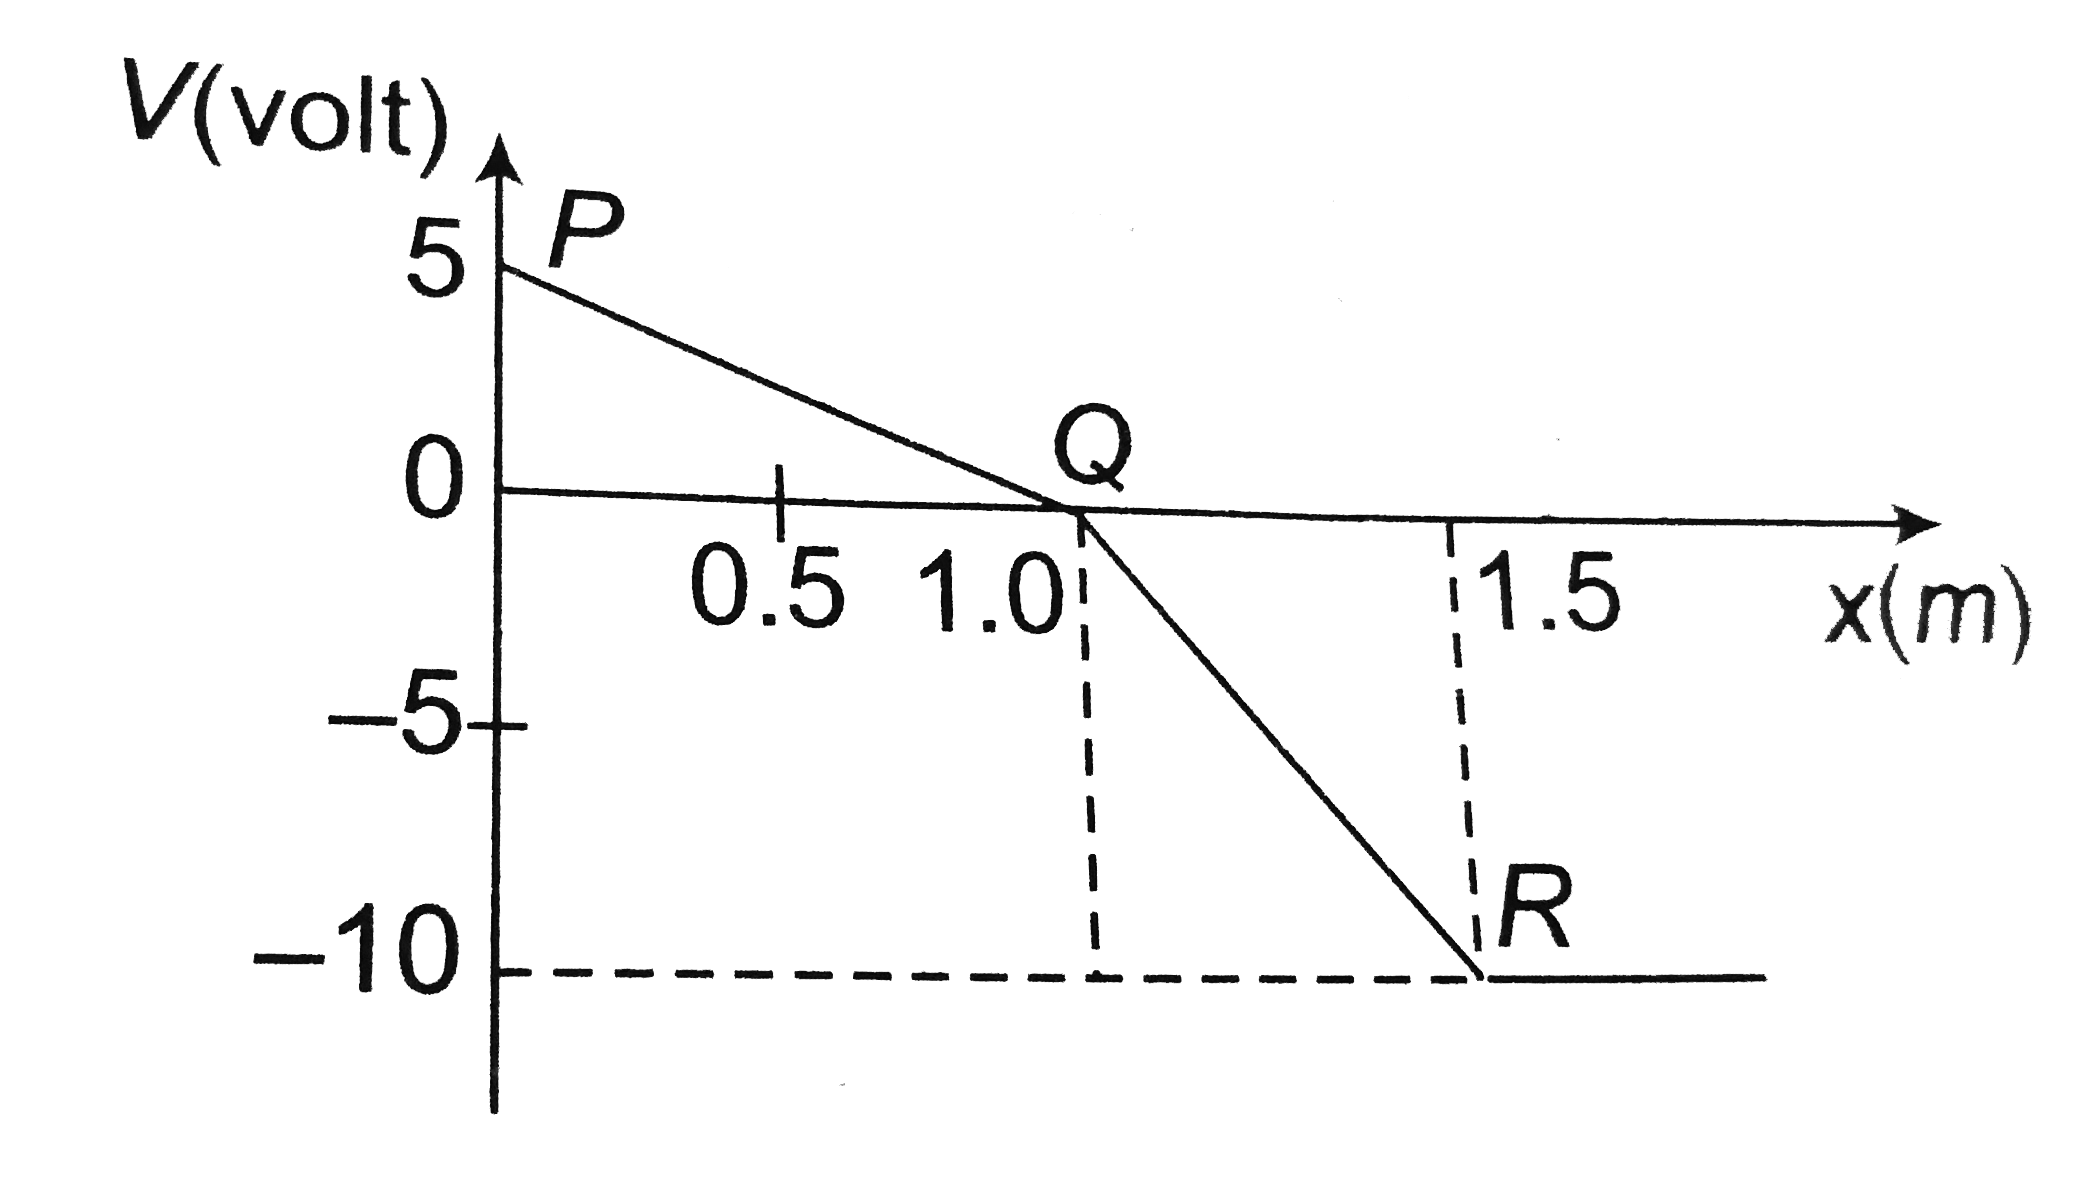
View Solution
