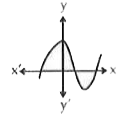
In the given graph of y = P(x) , the number of zeros is
 Solution in Kannada
4
3
2
7
The correct Answer is:B
Step by step video, text & image solution for In the given graph of y = P(x) , the number of zeros is by Maths experts to help you in doubts & scoring excellent marks in Class 10 exams.
Updated on:21/07/2023Topper's Solved these Questions
- POLYNOMIALSBOOK - ZEN PUBLICATIONCHAPTER - POLYNOMIALSEXERCISE - ZEN ADDITIONAL QUESTIONS ( Very short answer [VSA] type questions )
12 Videos
- POLYNOMIALSBOOK - ZEN PUBLICATIONCHAPTER - POLYNOMIALSEXERCISE - ZEN ADDITIONAL QUESTIONS (Very short answer [VSA] type questions (Answer the following questions :))
10 Videos
- POLYNOMIALSBOOK - ZEN PUBLICATIONCHAPTER - POLYNOMIALSEXERCISE - TEXTUAL EXERCISE ( Exercise 9 . 4 (Optional))
5 Videos
- PAIR OF LINEAR EQUATIONS IN TWO VARIABLESBOOK - ZEN PUBLICATIONCHAPTER - PAIR OF LINEAR EQUATIONS IN TWO VARIABLESEXERCISE - ADDITIONAL QUESTIONS - HIGHER ORDER THINKING SKILLS (HOTS)
12 Videos
- PROBABILITYBOOK - ZEN PUBLICATIONCHAPTER - PROBABILITYEXERCISE - ZEN ADDITIONAL QUESTIONS HOTS [HIGHER ORDER THINKING SKILLS]-QUESTIONS
24 Videos
Similar Questions
x2−5=1(x)
View SolutionIdentify the polynomials from the 10 algebraic equations given above. Give reason why some of them are not polynomials.
View SolutionVerify that the number given alongside of the cubic polynomials below are their zeroes. Also verify the relationship between the zeroes and the coefficients in each case.
i] 2x3+x2−5x+2,12,1,−2
ii] x3−4x2+5x−2,2,1,1
View SolutionSolve for x and y in the following question :
2x+2y+12x−y+59=0,9x+2y+62x−y+4=0
View SolutionA number x is chosen at random from numbers -3,-2,-1,0,1,2, and 3. find the probability that |x|<2.
View SolutionDetermine the point of symmetry of a regular hexagon.
View SolutionDtermine the images of the following figure about the given line :
View SolutionMatch the following Column A to Column B

View SolutionMatch the following Column A to Column B

View SolutionMatch the following Column A to Column B

View SolutionFind the area of the figure given below.

View SolutionThe area of the shaded part in the figure given below is ______.

View SolutionThe inequation represented by the graph given below is :
View SolutionThe inequation that best describes the graph given below is _________
View SolutionThe inequation that best describes the following graph is _________
View SolutionWhich inequations represent the shaded region in the given figure
View Solution
