The following table shows the ages of the patients admitted in a hospital during a year:

Find the mode and the mean of the data given above. Compare and interpret the two measures of central tendency. Solution in Kannada
The correct Answer is:Maximum = 36.8 years, Average = 35.37 years
Step by step video, text & image solution for The following table shows the ages of the patients admitted in a hospital during a year: Find the mode and the mean of the data given above. Compare and interpret the two measures of central tendency. by Maths experts to help you in doubts & scoring excellent marks in Class 10 exams.
Updated on:21/07/2023Topper's Solved these Questions
- STATISTICS Book:ZEN PUBLICATIONChapter:STATISTICS Exercise:TEXTUAL EXERCISES (Exercise 13.3)
Explore 7 Videos
- STATISTICS Book:ZEN PUBLICATIONChapter:STATISTICS Exercise:TEXTUAL EXERCISES (Exercise 13.4)
Explore 3 Videos
- STATISTICS Book:ZEN PUBLICATIONChapter:STATISTICS Exercise:TEXTUAL EXERCISES (Exercise 13.1)
Explore 9 Videos
- SOME APPLICATIONS OF TRIGONOMETRYBook:ZEN PUBLICATIONChapter:SOME APPLICATIONS OF TRIGONOMETRYExercise:ADDITIONAL QUESTIONS (VALUE BASED QUESTIONS )
Explore 2 Videos
- SURFACE AREAS AND VOLUMESBook:ZEN PUBLICATIONChapter:SURFACE AREAS AND VOLUMESExercise:ZEE ADDITIONAL QUESTIONS -HOTS [HIGHER ORDER THINKING SKILLS]-QUESTIONS
Explore 11 Videos
Similar Questions
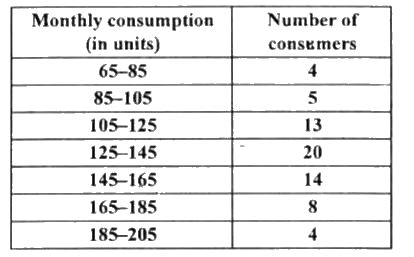
The following frequency distribution gives the monthly consumption of electricity of 68 consumers of a locality. Find the median, mean and mode of the data and compare them.

View SolutionThe following distribution gives the daily income of 50 workers of a factory.

Convert the distribution above to a less than type cumulative frequency distribution, and draw its ogive.
View SolutionA survey was conducted by a group of students as a part of their environment awareness programme, in which they collected the following data regarding the number of plants in 20 houses in a locality. Find the mean number of plants per house.

Which method did you use for finding the mean, and why?
View SolutionThe angle of elevation of the top of a chimney from the foot of a tower is 60∘ and the angle of depression of the foot of the chimney from the top of the tower is 30∘. If the height of the tower is 40m, find the height of the chimney. According to pollution control norms, the minimum height of a smoke-emitting chimney should be 100m. State if the height of the above mentioned chimney meets the pollution control norms. What value is discussed in this question?
View SolutionA sector of a circular is of radius 12 cm and angle 120∘. It is rolled up so that two bounding radii are joined together to form a cone. Find the volume of the cone.
View SolutionThe following table shows the ages of the patients admitted in a hospital during a year:Find the mode and the mean of the data given above. Compare and interpret the two measures of central tendency.
View SolutionHow many lines of symmetry does the above figure have ?
View SolutionDetermine the point of symmetry of a regular hexagon.
View SolutionDtermine the images of the following figure about the given line :
View SolutionMatch the following Column A to Column B

View SolutionMatch the following Column A to Column B

View SolutionMatch the following Column A to Column B

View SolutionThe inequation represented by the graph given below is :
View SolutionThe inequation that best describes the graph given below is _________
View SolutionThe inequation that best describes the following graph is _________
View Solutionनिम्नलिखित सारणी किसी अस्पताल में एक विशेष वर्ष में भर्ती हुए रोगियों की आयु को दर्शाती हैं :

उपरोक्त आँकड़ों से बहुलक ज्ञात कीजिए।
View Solution