Draw graphs a→t,v→tandx→t for the object falling freely. Solution in Gujrati

For object falling freely, acceleration is constant and equation to negative g. Thus, graph (a) shows the change in acceleration with respect to time (a→t).
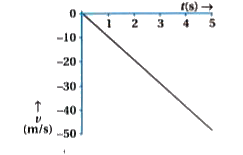
Velcity of object falling freely, v=−gt. THus, graph (b) is obtained for v→t.

For object falling freely, h=12gt2. Thus graph (c) is obtained for x→t.
Topper's Solved these Questions
- BOOK - KUMAR PRAKASHANCHAPTER - MOTION IN A STRAIGHT LINE EXERCISE - SECTION-A TRY YOUR SELF (VSQs)52videos
MOTION IN A STRAIGHT LINE
- BOOK - KUMAR PRAKASHANCHAPTER - MOTION IN A STRAIGHT LINE EXERCISE - SECTION-B58videos
MOTION IN A STRAIGHT LINE
- BOOK - KUMAR PRAKASHANCHAPTER - MECHANICAL PROPERTIES OF FLUIDS EXERCISE - QUESTION PAPER (SECTION -C)3videos
MECHANICAL PROPERTIES OF FLUIDS
- BOOK - KUMAR PRAKASHANCHAPTER - OBJECTIVE QUESTIONS AS PER NEW PAPER STYLE EXERCISE - CHAPTER - 8 (Match Type questions)5videos
OBJECTIVE QUESTIONS AS PER NEW PAPER STYLE
Similar Questions
How can we determine whether the object is in rest or not?
01:00View SolutionA car is moving along a straight line, say OP in It move from O to P in 18 s and returns from P to Q in 6s, where OP=360 m and OQ=240 m. What are the average velocity and average speed of the car in going (a) from O to P ? And (b) from O to P and back to Q ?
02:58View SolutionGlycerine flows steadily through a horizontal tube of length 1.5m and radius 1.0 cm . If the amount of glycerine collected per second at one is 4.0×10⁻³kgs−1 , what is the pressure difference between the two ends of the tube ? (Density of glycerine =1.3×10103kgm−3 and viscosity of glycerine =0.83 Pa s). [ you may also like to check if the assumption of laminar flow in the tube is correct]
02:53View SolutionType of satellites are given in Column-I and their uses are given in Column-II. Match them properly :
Column-IColumn-II(1) Polar satellite(a) Tele communication(2) Geo-stationary satellite(b) Investigation(c) For information about atmosphere01:16View SolutionDraw the x-t graph of an object in uniform motion.
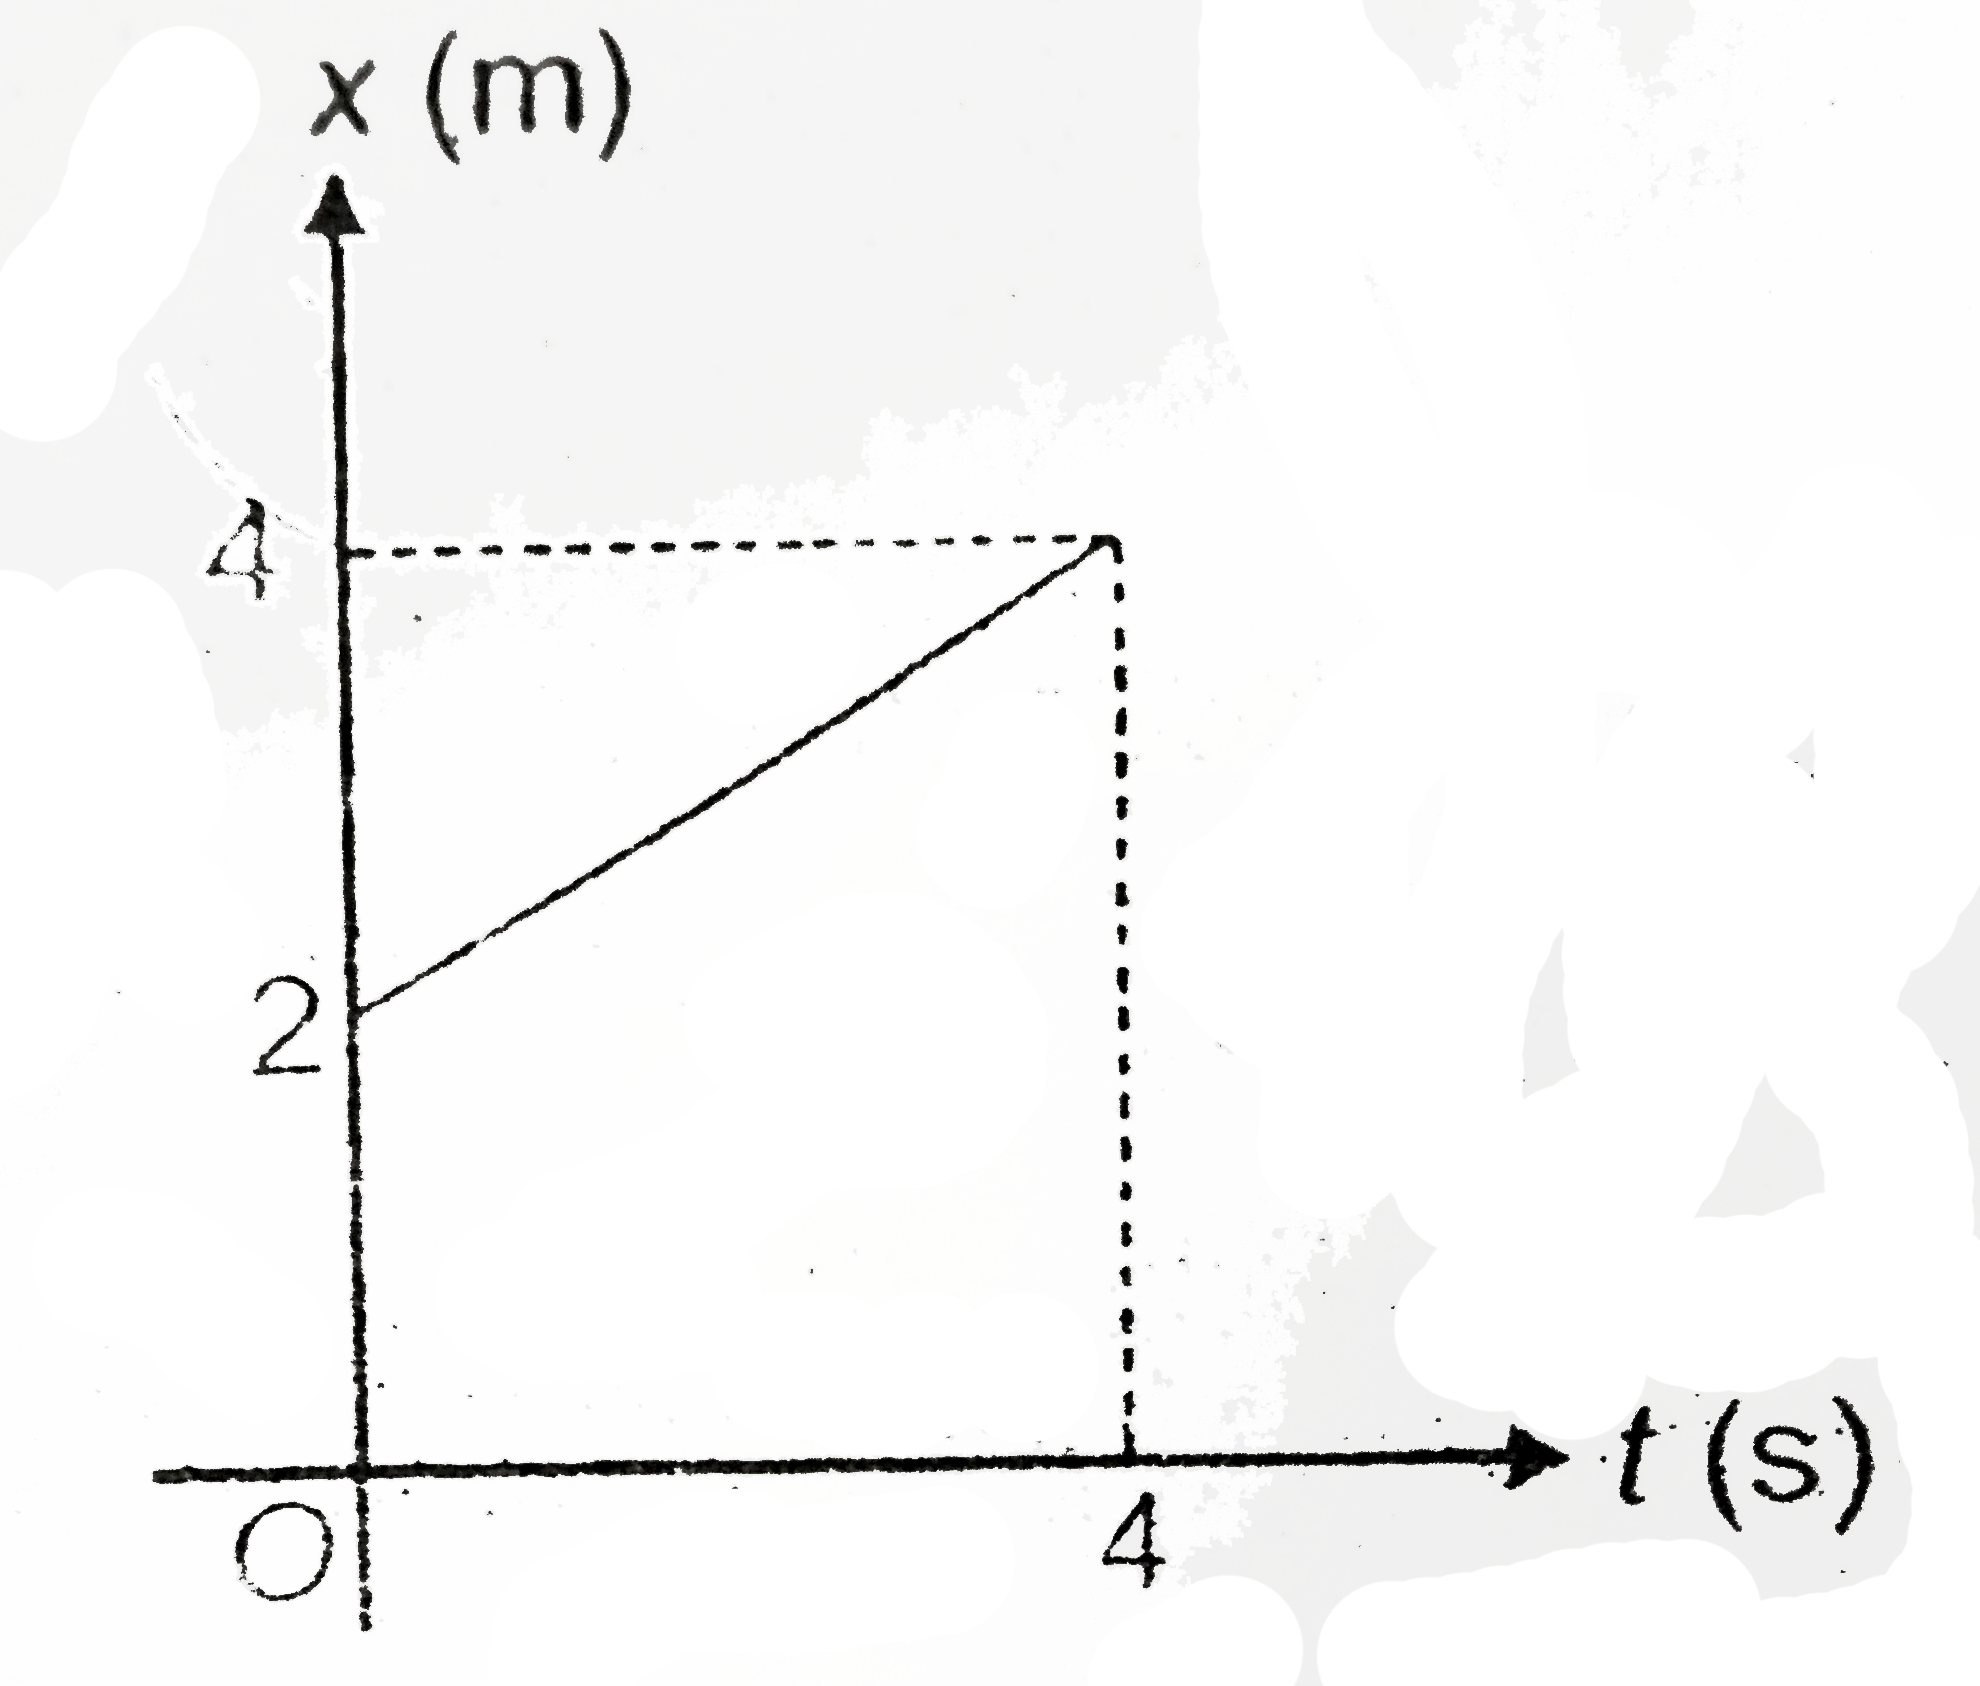
05:52View SolutionIn the given x - t graph. Find the position of an object at t = 3 second
 03:43View Solution
Represent the following v - t graph on a a - t graph.
05:09View SolutionRepresent the following a-t graph on a v-t graph.
03:12View SolutionWhat is v-t graph? Derive the expression x = V_0 t + 1//2 at^2 using v-t graph.
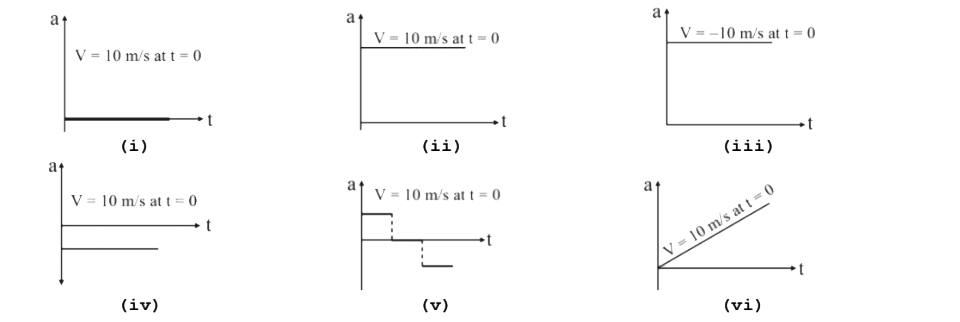
01:55View SolutionDraw the v-t graphs for the given a-t graphs for a particle moving in one dimension.
 07:55View Solution
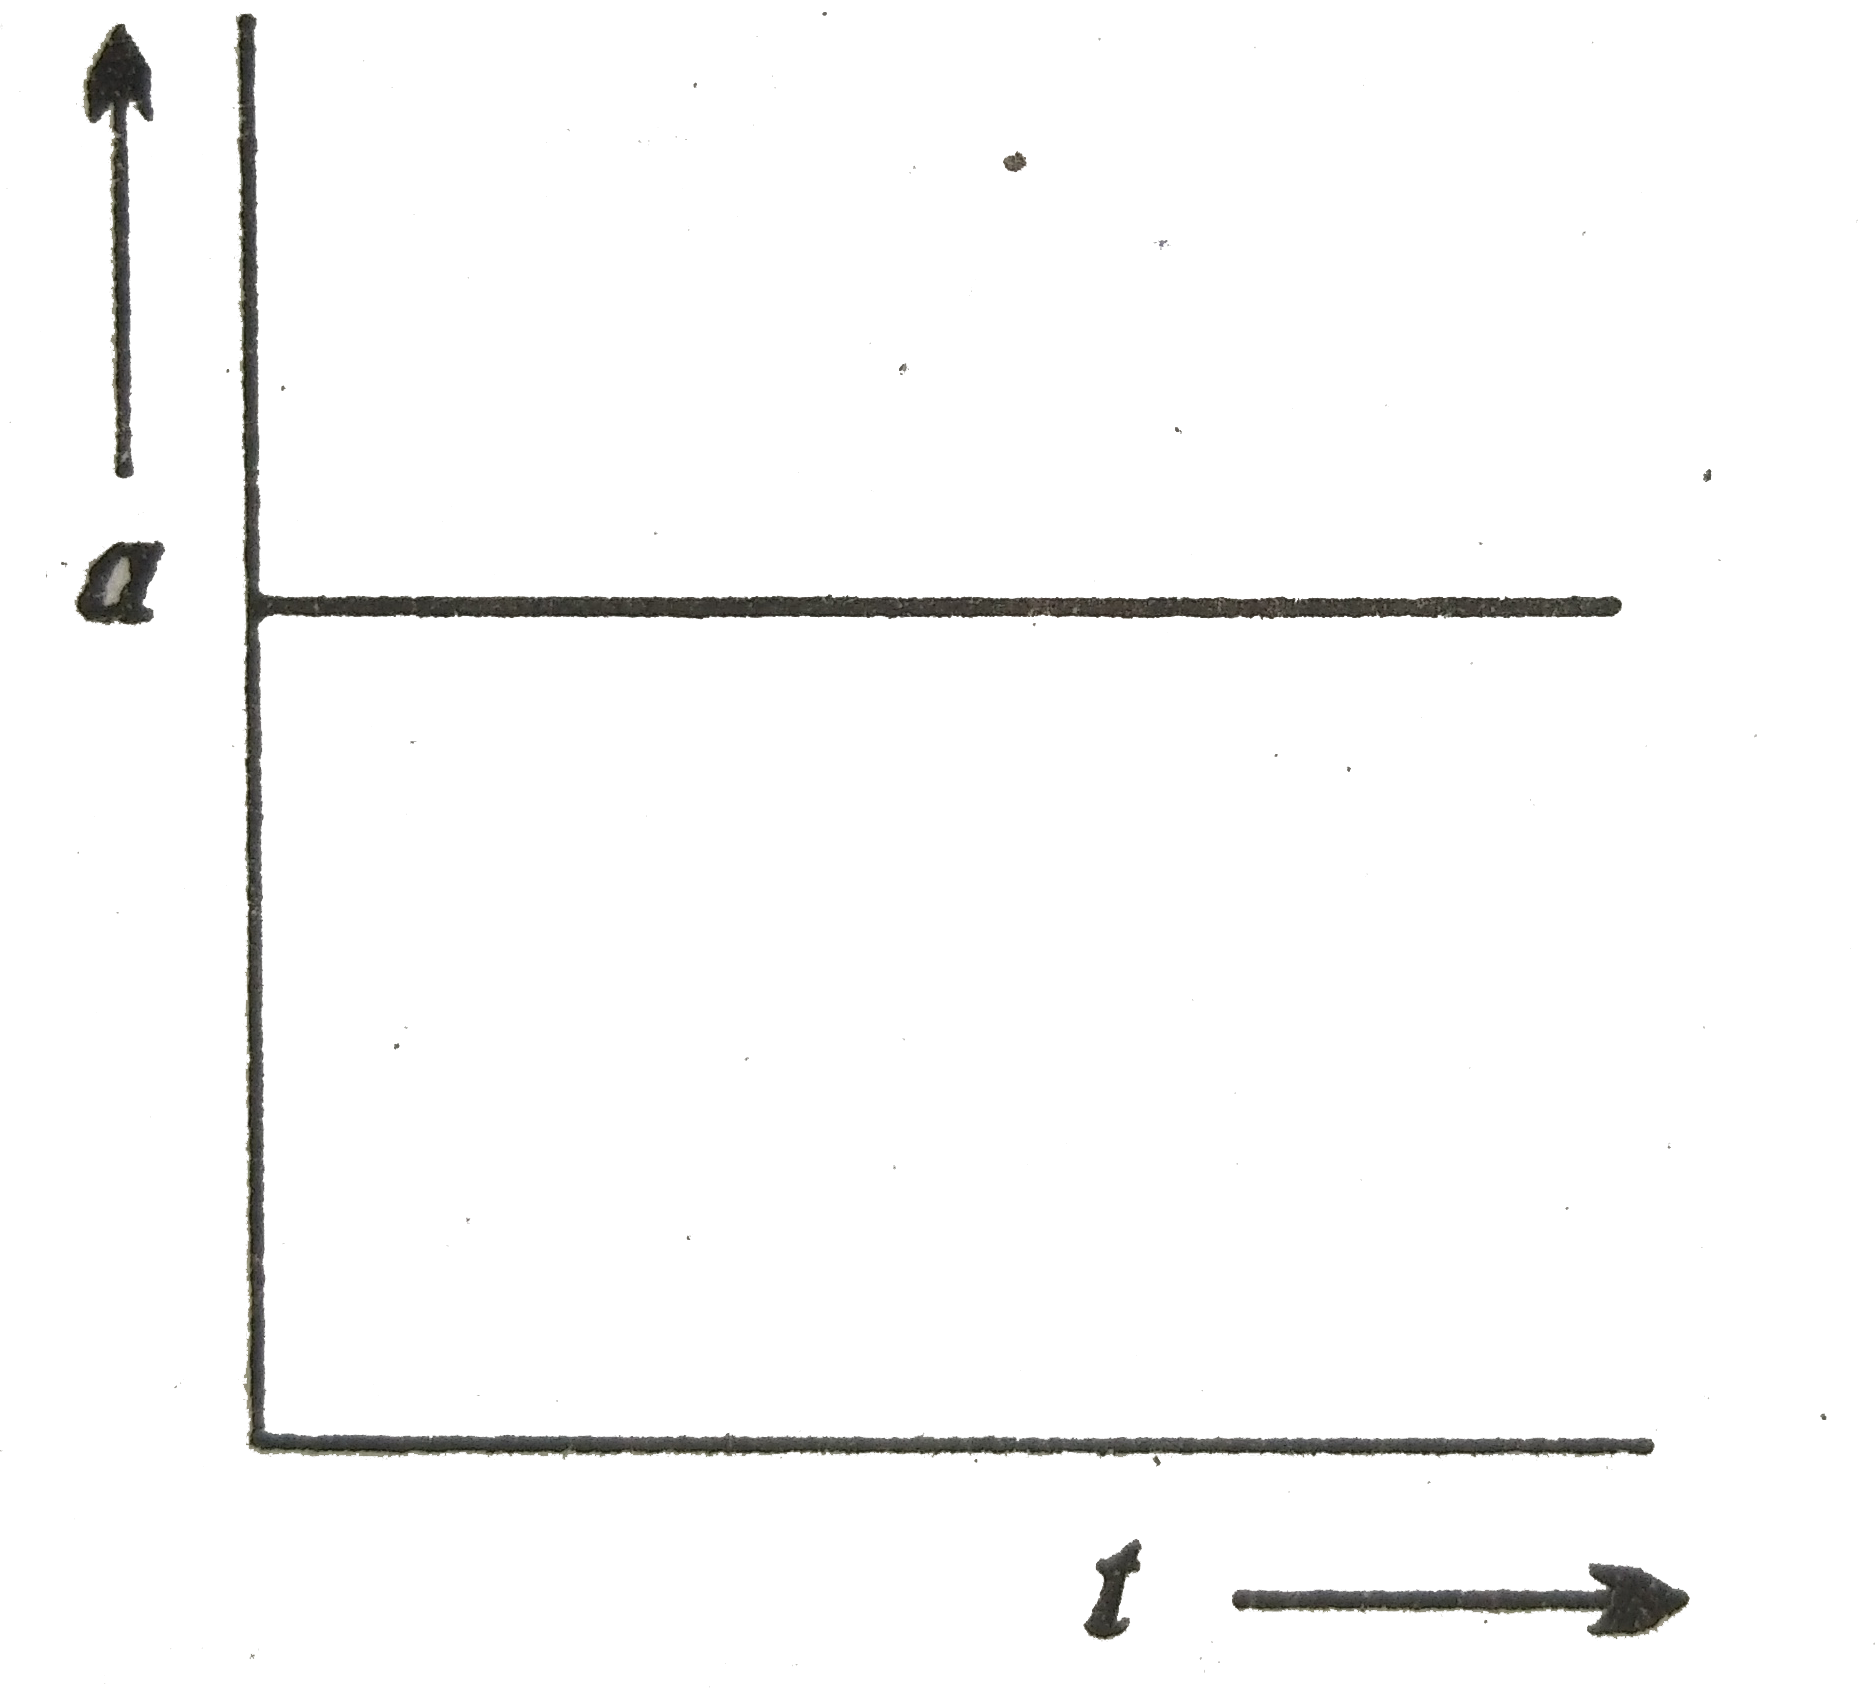
संलग्न चित्र में विरामावस्था से एक गतिमान पिंड के लिए a−t ग्राफ प्रदर्शित किया गया है। उस पिंड के लिए
(i) v−t ग्राफ तथा (ii ) x−t ग्राफ खींचिये।
 12:12View Solution
संलग्न चित्र में गतिमान वस्तु के लिए v−t ग्राफ प्रदर्शित किया गया है । वस्तु का त्वरण क्या होगा? वस्तु की गति के लिए x−t ग्राफ खींचिए ।
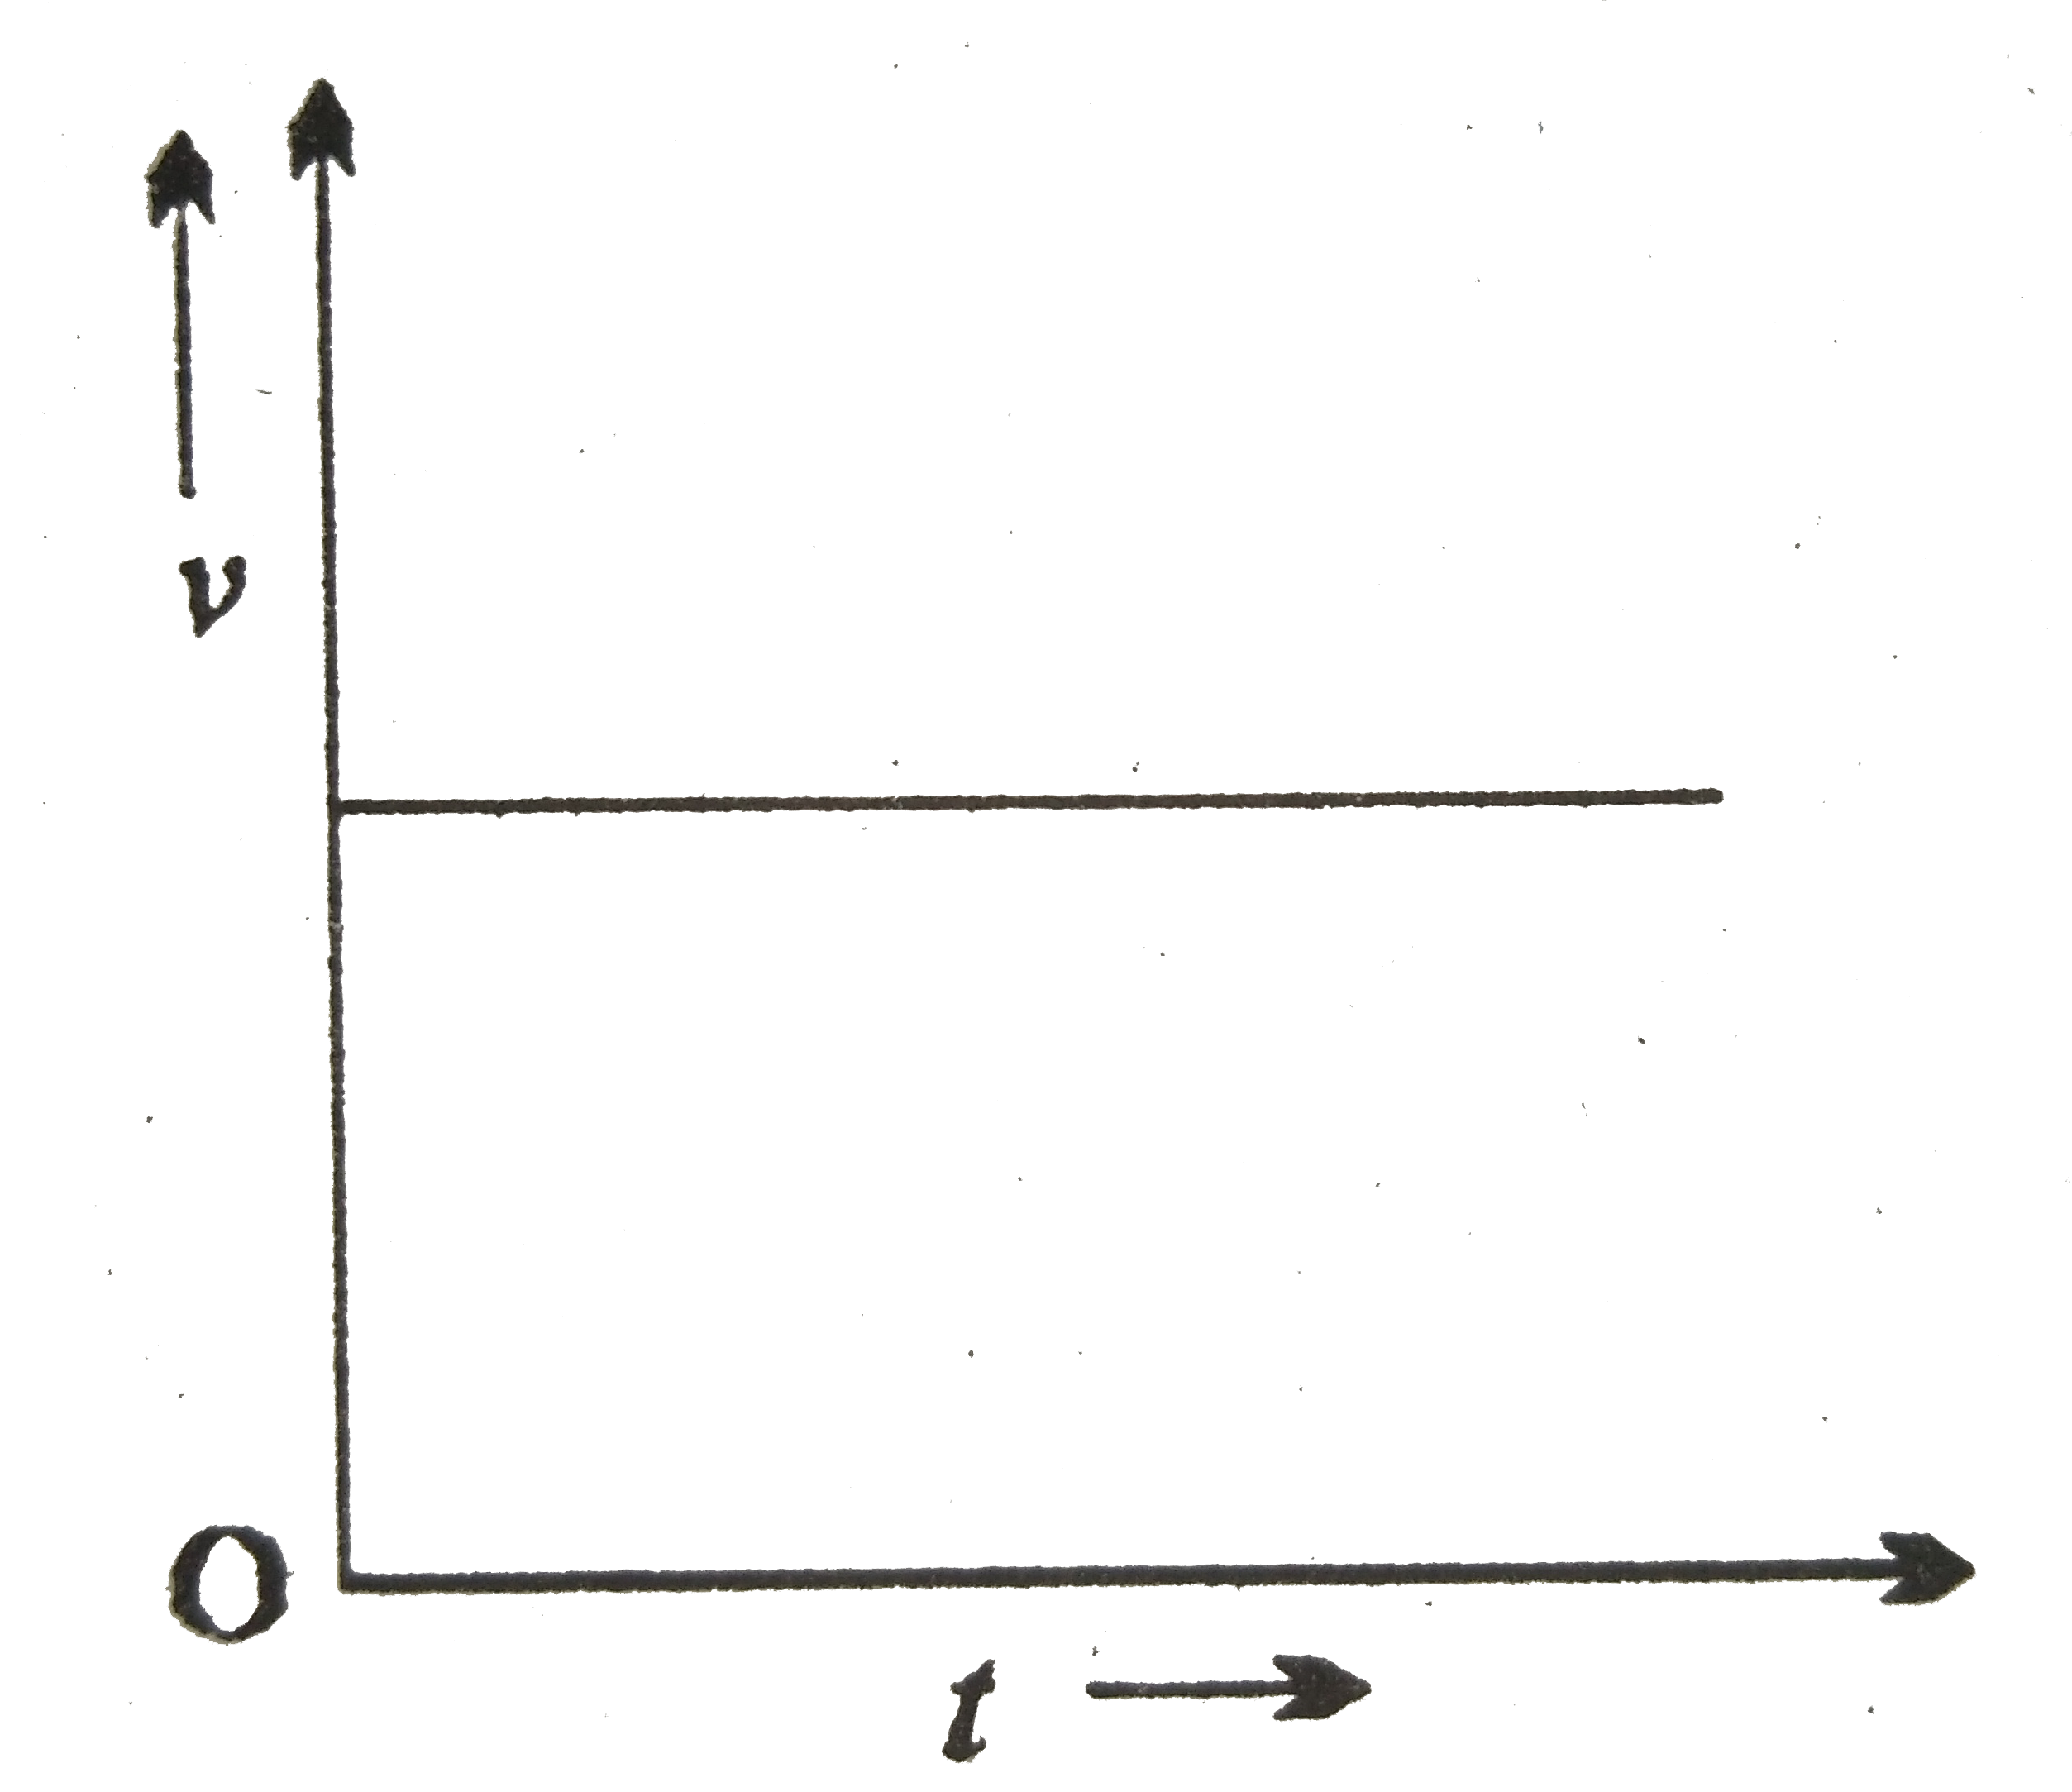 01:02:51View Solution
Draw v to t graph for constant velocity and explain it.
02:09View SolutionExplain by drawing graphs of displacement x(t)→t, velocity v(t)→t and acceleration a(t)→t of SHM for initial phase zero.
02:50View SolutionCorresponding to (p - T) graph as shown in figure, draw (a) P - V graph (b) V - T graph ( c) rho - T graph and (d) U - T graph.
01:39View Solution

