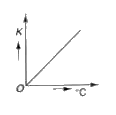
A graph was plotted taking the temperature in .∘C along the X-axis and the corresponding temperature in Kelvin along the Y-axis. Which of the curves in Fig, 6.1 most correctly represents this behaviour?


The correct Answer is:A
To solve the problem, we need to analyze the relationship between temperature in degrees Celsius (°C) and temperature in Kelvin (K). The relationship is given by the formula:
K=°C+273
1. Understanding the Relationship:
- The formula K=°C+273 indicates that for every degree increase in Celsius, the Kelvin temperature increases by the same amount. This means that the relationship is linear.
2. Identifying the Axes:
- In the graph, the x-axis represents temperature in degrees Celsius (°C) and the y-axis represents temperature in Kelvin (K).
3. Identifying the Equation Format:
- The equation K=°C+273 can be rewritten in the form of a straight line equation y=mx+c, where:
- y is the temperature in Kelvin (K),
- x is the temperature in Celsius (°C),
- m is the slope of the line,
- c is the y-intercept.
4. Determining the Slope and Intercept:
- From the equation K=°C+273:
- The slope m=1 (indicating a 45-degree angle with respect to the x-axis).
- The y-intercept c=273 (the point where the line crosses the y-axis).
5. Analyzing the Graph Options:
- Since the slope is positive (1), the graph should be an upward sloping line.
- The line should intersect the y-axis at K=273 (when °C=0).
- We need to find the option that matches these characteristics: a straight line with a positive slope and a y-intercept at 273.
6. Selecting the Correct Option:
- After examining the provided options in Fig. 6.1, we look for a straight line that has a positive slope and intersects the y-axis at 273.
- The correct option will be the one that satisfies these conditions.
Conclusion
The correct answer is Option 1, as it represents a straight line with a positive slope of 1 and a y-intercept at 273.
- The formula K=°C+273 indicates that for every degree increase in Celsius, the Kelvin temperature increases by the same amount. This means that the relationship is linear.
- In the graph, the x-axis represents temperature in degrees Celsius (°C) and the y-axis represents temperature in Kelvin (K).
- The equation K=°C+273 can be rewritten in the form of a straight line equation y=mx+c, where:
- y is the temperature in Kelvin (K),
- x is the temperature in Celsius (°C),
- m is the slope of the line,
- c is the y-intercept.
- From the equation K=°C+273:
- The slope m=1 (indicating a 45-degree angle with respect to the x-axis).
- The y-intercept c=273 (the point where the line crosses the y-axis).
- Since the slope is positive (1), the graph should be an upward sloping line.
- The line should intersect the y-axis at K=273 (when °C=0).
- We need to find the option that matches these characteristics: a straight line with a positive slope and a y-intercept at 273.
- After examining the provided options in Fig. 6.1, we look for a straight line that has a positive slope and intersects the y-axis at 273.
- The correct option will be the one that satisfies these conditions.
The correct answer is Option 1, as it represents a straight line with a positive slope of 1 and a y-intercept at 273.
Topper's Solved these Questions
- HEATBOOK - MCGROW HILL PUBLICATIONCHAPTER - HEATEXERCISE - HIGHER ORDER THINKING QUESTIONS
15 Videos
- GRAVITATION BOOK - MCGROW HILL PUBLICATIONCHAPTER - GRAVITATION EXERCISE - HIGHER ORDER THINKING QUESTIONS
25 Videos
- HEATING AND MAGNETIC EFFECTS OF CURRENT BOOK - MCGROW HILL PUBLICATIONCHAPTER - HEATING AND MAGNETIC EFFECTS OF CURRENT EXERCISE - HIGHER ORDER THINKING QUESTIONS
34 Videos
Similar Questions
A graph is drawn between centigrade temperatures of a body along x-axis and corresponding Fahrenheit temperatures along y-axis. Slope of the graph is
View SolutionA graph is plotted by taking pressure along y-axis and centigrade temperature along X-axis for an ideal gas at constant volume. x intercept of the graph is
View Solution
Knowledge Check
If a graph is plotted taking the temperature in fahrenheit along the Y- axis and the corresponding temperature in celsins along X - axis it will be straight line
Ahaving a positive intercept on the Y- axisBhaving a positive intercept on X- axisCpassing through originDhaving negative intercepts on both the axisIf a graph is plotted taking the temperature in Fahrenheit along the Y-axis and the corresponding temperature in Celsius along the X-axis, it will be a straight line
Ahaving a positive intercept on the Y-axisBhaving a positive intercept on the X-axisCpassing through the originDhaving a negative intercepts on both the axisA graph is plotted taking .∘C along the Y-axis and .∘F along the X-axis. It is a/an
AparabolaBstraight lineCellipseDcircle
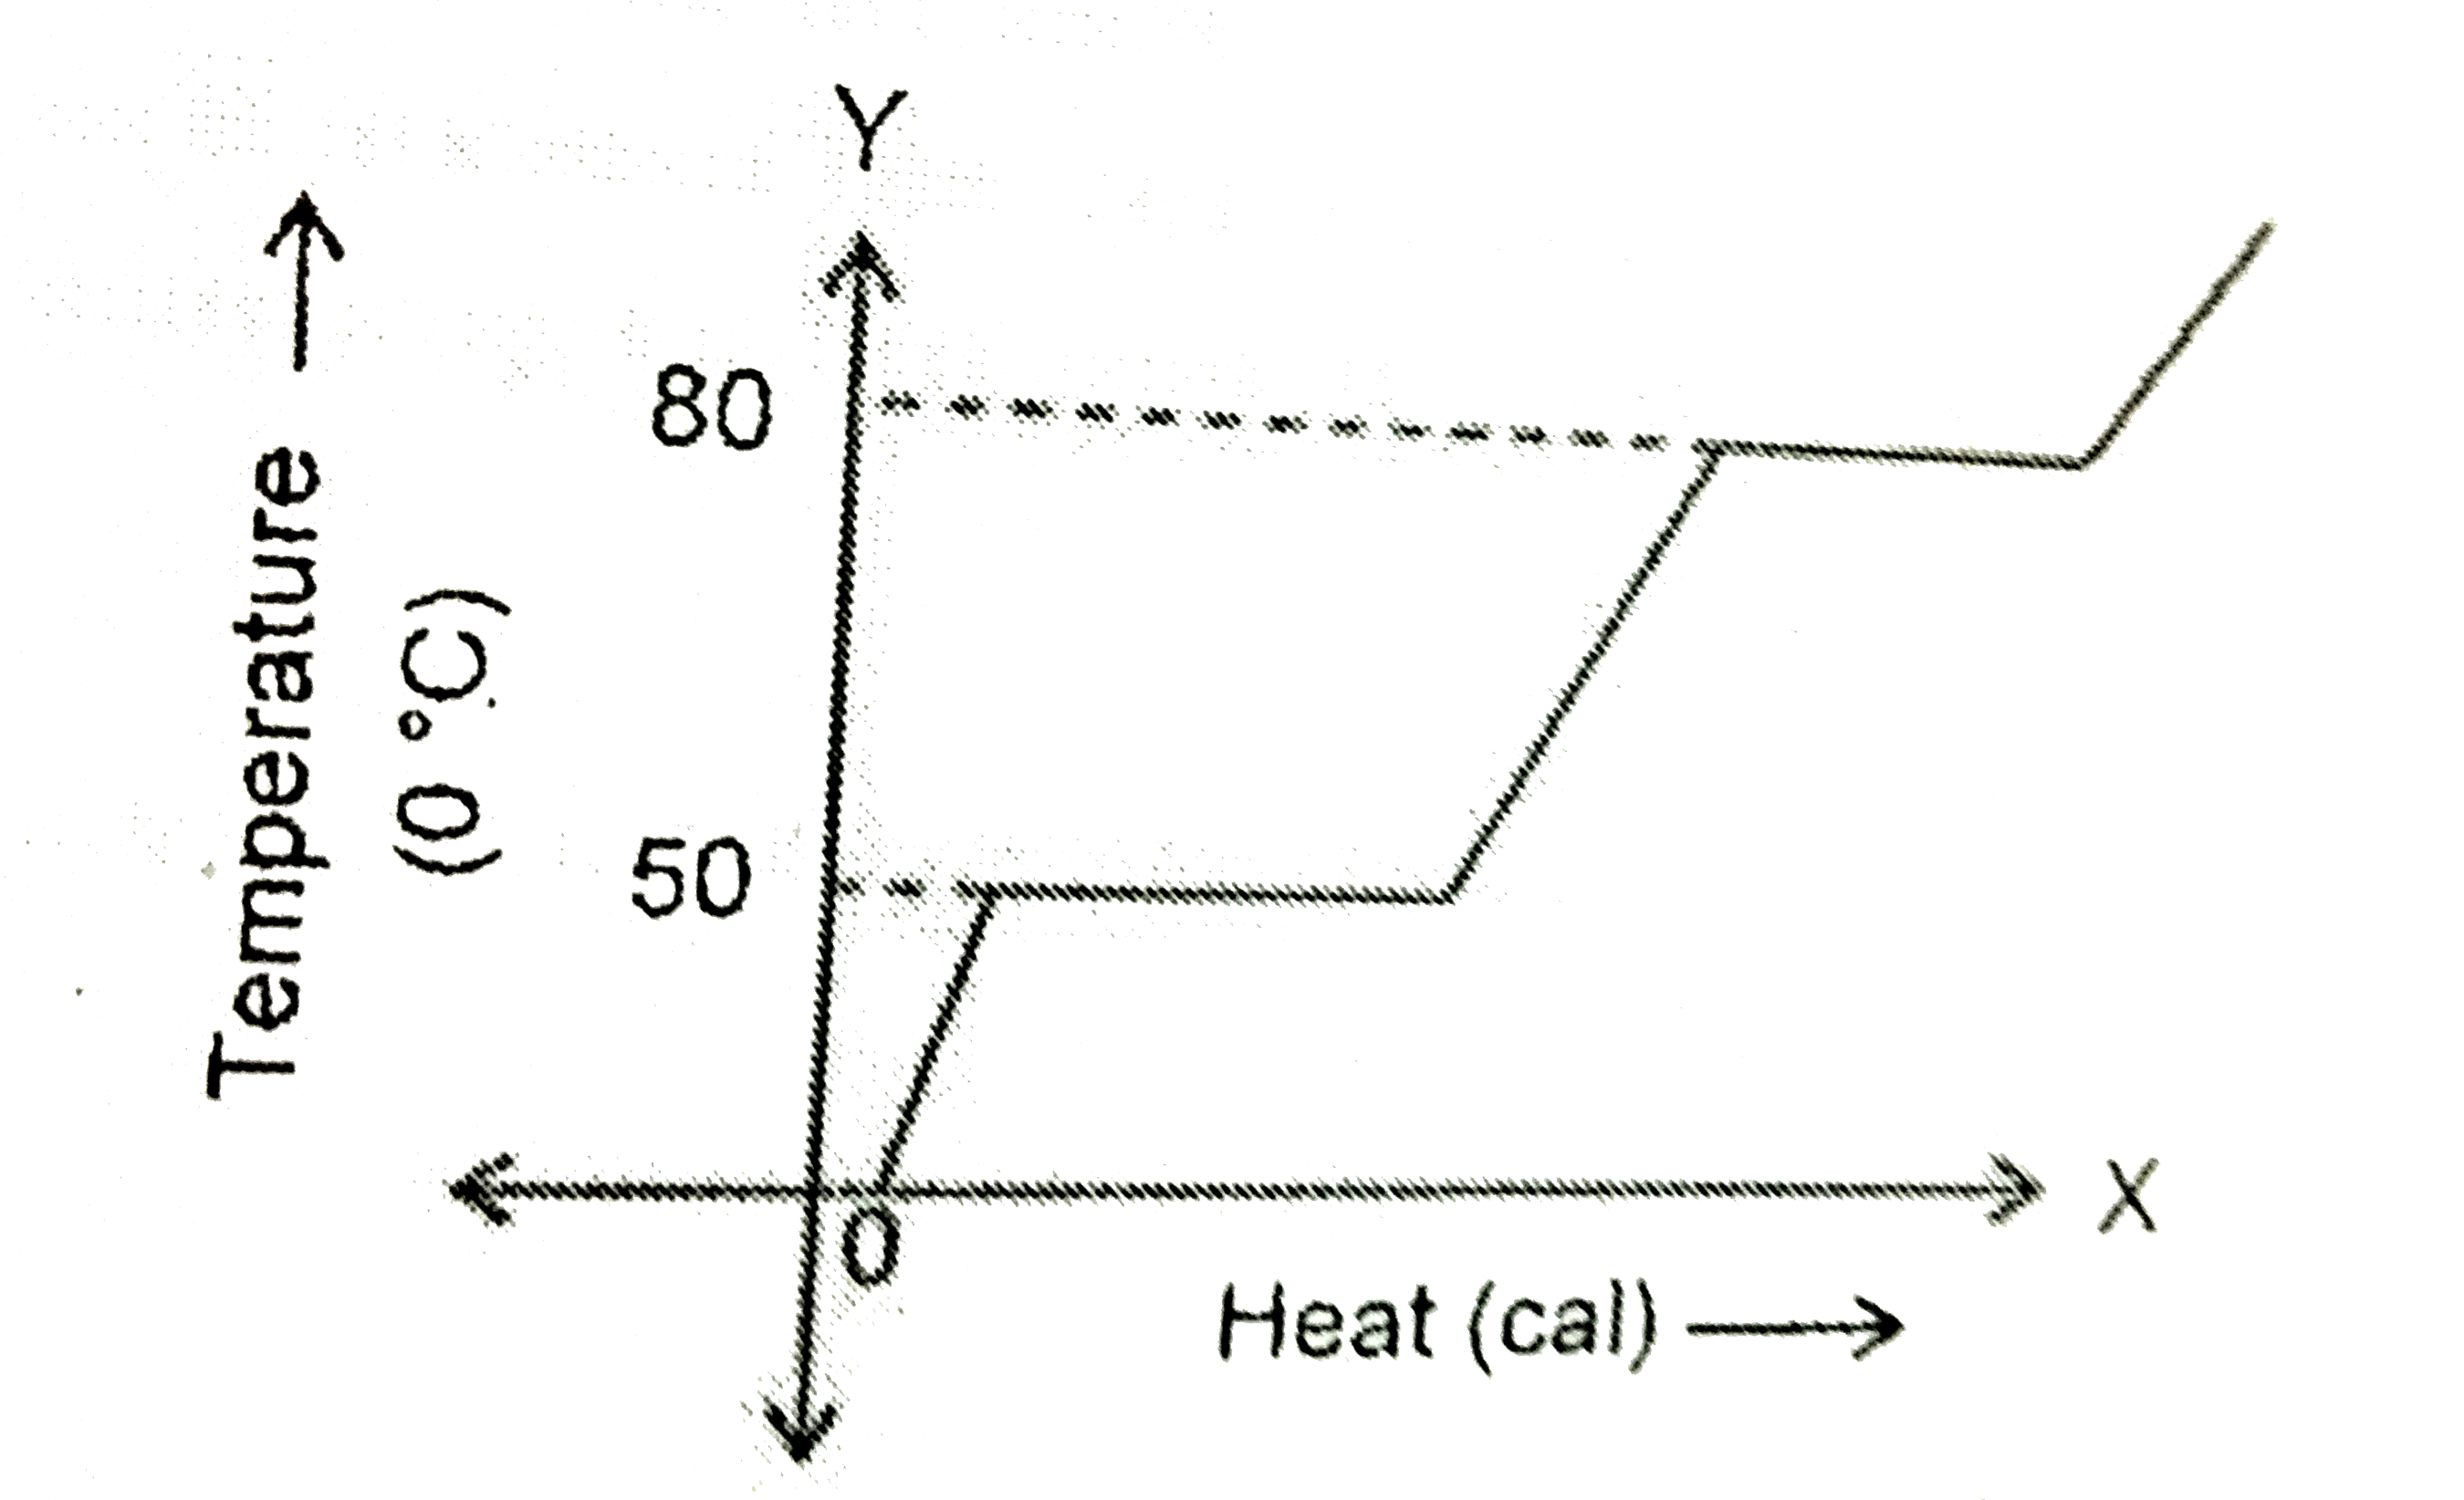
A graph is drawn by taking the rise in temperature on Y axis and heat supplied on x axis .Find out the melting point and boiling point of heat substance

View SolutionA graph is drawn by taking the rise in temperature on Y axis and heat supplied on x axis .Find out the melting point and boiling point of heat substance

View SolutionA graph is plotted taking ∘––C along the Y - axis and of along the X - axis .It is a /an
View Solution100 g of ice at −15∘C was heated. The rise in temperature of ice was plotted against the heat given to ice. Which of the following graphs (Fig. 6.2) correctly depicts this behaviour?
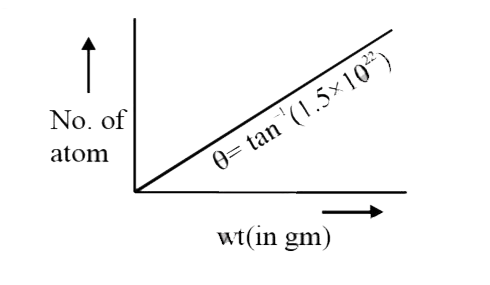
View SolutionA graph is plotted for an element, by putting its weight on X-axis
and the corresponding number of number of atoms on Y-axis. Determine
the atomic weight of the element for which the graph is plotted.

View Solution
