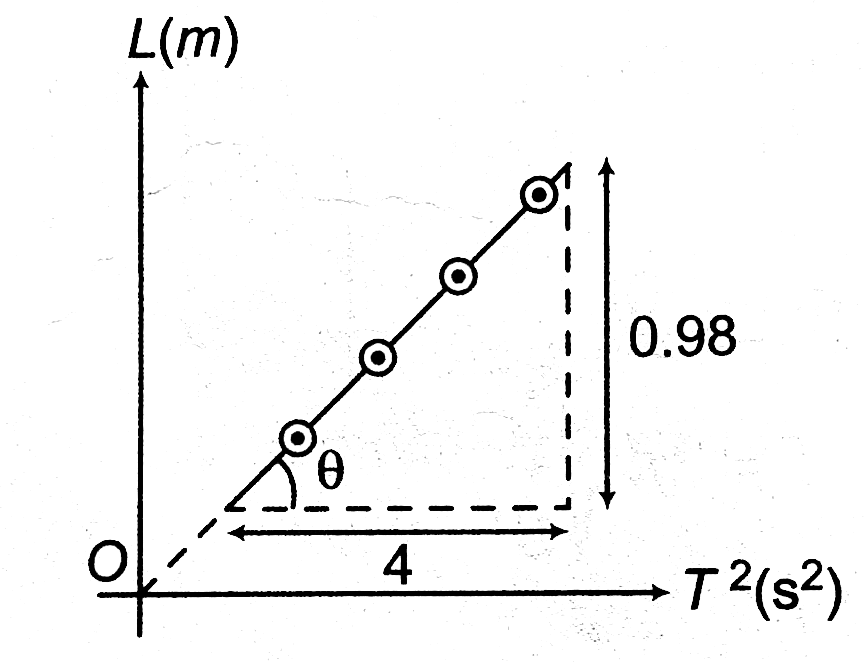
The graph between L and T2 is


The correct Answer is:A
To determine the relationship between the length of a pendulum (L) and the square of its time period (T²), we can follow these steps:
1. Understand the Formula for Time Period of a Simple Pendulum:
The time period (T) of a simple pendulum is given by the formula:
T=2π√Lg
where g is the acceleration due to gravity.
2. Square the Time Period Formula:
To find the relationship between L and T2, we square both sides of the equation:
T2=(2π)2⋅Lg
This simplifies to:
T2=4π2g⋅L
3. Identify the Relationship:
From the equation T2=4π2g⋅L, we can see that T2 is directly proportional to L. This means that as the length L increases, T2 also increases.
4. Graphical Representation:
When plotting T2 on the y-axis and L on the x-axis, the graph will be a straight line. This is because of the direct proportionality established in the previous step.
5. Conclusion:
The graph between L and T2 will be a straight line, indicating a linear relationship.
Final Answer:
The graph between L and T2 is a straight line.
---
The time period (T) of a simple pendulum is given by the formula:
T=2π√Lg
where g is the acceleration due to gravity.
To find the relationship between L and T2, we square both sides of the equation:
T2=(2π)2⋅Lg
This simplifies to:
T2=4π2g⋅L
From the equation T2=4π2g⋅L, we can see that T2 is directly proportional to L. This means that as the length L increases, T2 also increases.
When plotting T2 on the y-axis and L on the x-axis, the graph will be a straight line. This is because of the direct proportionality established in the previous step.
The graph between L and T2 will be a straight line, indicating a linear relationship.
The graph between L and T2 is a straight line.
Topper's Solved these Questions
- WAVE MOTION AND SOUND BOOK - MCGROW HILL PUBLICATIONCHAPTER - WAVE MOTION AND SOUND EXERCISE - HIGH ORDER THINKING QUESTIONS
22 Videos
- SOURCES OF ENERGY BOOK - MCGROW HILL PUBLICATIONCHAPTER - SOURCES OF ENERGY EXERCISE - ELEMENTARY QUESTIONS
82 Videos
- WORK AND ENERGYBOOK - MCGROW HILL PUBLICATIONCHAPTER - WORK AND ENERGYEXERCISE - HIGHER ORDER THINKING QUESTIONS
29 Videos
Similar Questions
Knowledge Check
The graph between L and T is correctly shown by
A B
B C
C D
D
Assertion : For a simple pendlume the graph between ans T2 is hyperbola
Reason : T=2π√g1AIf both assertion and reason are true and the reasopn is correct explanation of the assertionBIf both assertion and reason are true and but not the correct explanation of assertionCIf assertion is true but the reason is falseDIf both assertion and reason are falseWhile determining the value of g using simple pendulum, we plot a graph between l and T2 which is
Aa straight lineBa parabolaCan ellipseDa circle
The graph between χ and T for paramagnetic material will be represented by
View SolutionThe graph between (P/T) and T for a gas at constant volume will be:
View SolutionThe graph between χ and 1/T for paramagnetic material will be represented by
View SolutionFor a simple pendulum, the graph between T2andL (where T is the time period & Lis the length) is
View SolutionThe graph between time period (T) and length (l) of a simple pendulum is
View Solution

 .
.