Which graph of the following represents the graph between log p (on Y - axis) and 1/T (on X - axis)?
A
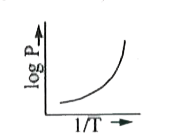
B
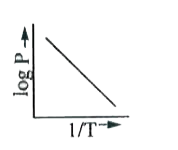
C
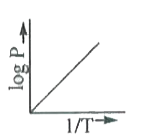
D
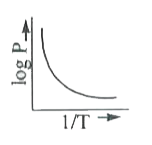
Text Solution
The correct Answer is:B
|
Topper's Solved these Questions
- SOLUTIONS BOOK - AAKASH SERIESCHAPTER - SOLUTIONS EXERCISE - Objective Exercise -2
110 Videos
- SOLUTIONS BOOK - AAKASH SERIESCHAPTER - SOLUTIONS EXERCISE - Objective Exercise -3 (PREVIOUS NEEET/AIPMT )
24 Videos
- SOLUTIONS BOOK - AAKASH SERIESCHAPTER - SOLUTIONS EXERCISE - Subjective Exercise-3 (Problems)
7 Videos
- SOLIDS STATEBOOK - AAKASH SERIESCHAPTER - SOLIDS STATEEXERCISE - PRACTICE EXERCISE
63 Videos
- STATES OF MATTER BOOK - AAKASH SERIESCHAPTER - STATES OF MATTER EXERCISE - ADDITIONAL PRACTICE EXERCISE -PRACTICE SHEET (ADVANCED) (LINKED COMPREHENSION TYPE QUESTIONS) (PASSAGE- IV)
2 Videos
Similar Questions
Knowledge Check
Which one of the following represents the graph between log P on Y - axis and 1/T on X - axis ? (P = vapour pressure of a liquid, T = absolute temperature)
A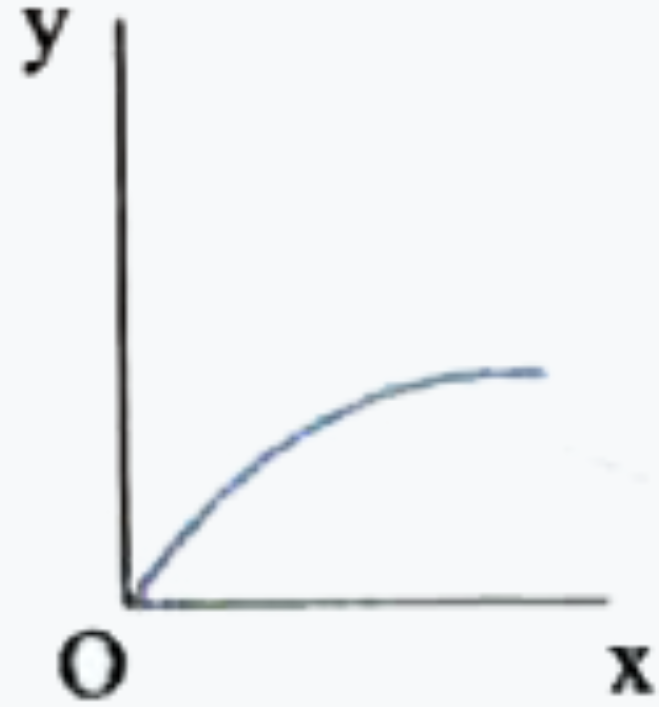 B
B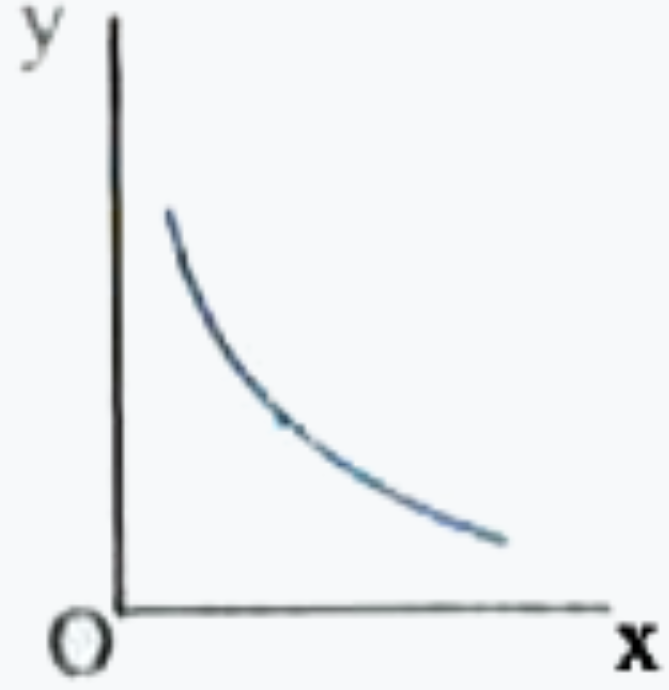 C
C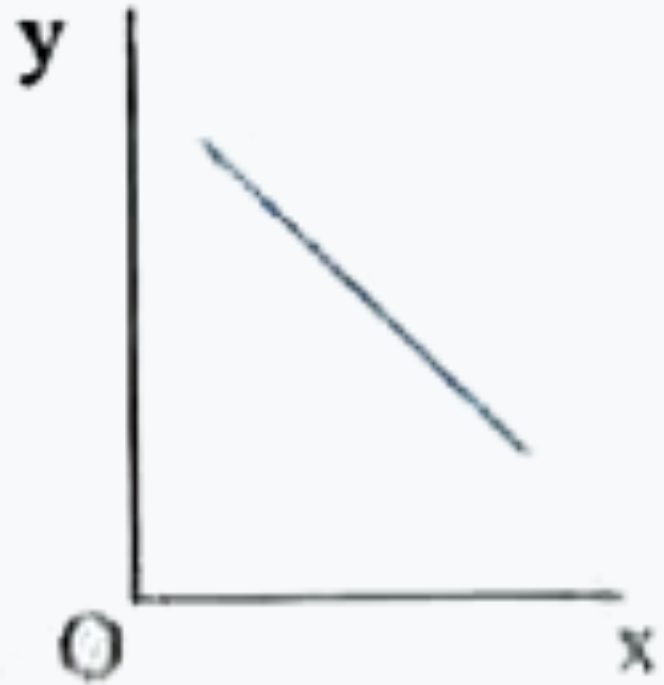 D
D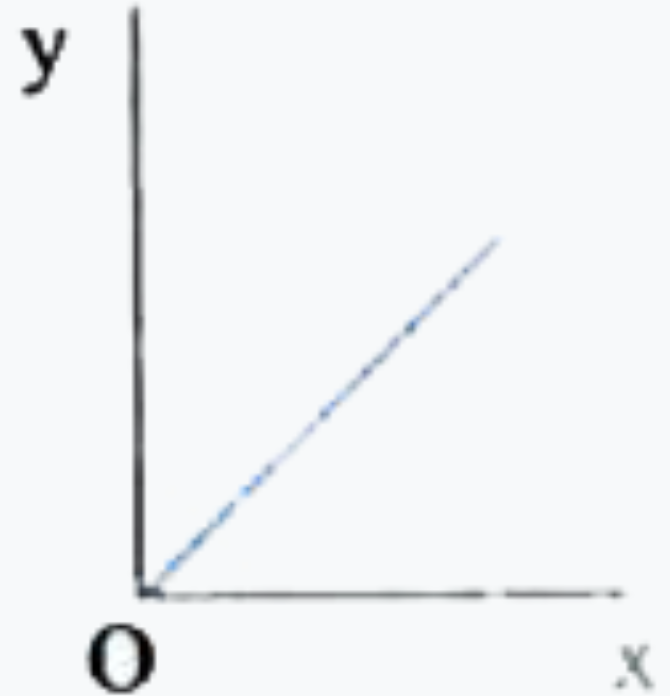
Which of these curves represents Henry's law graph between partial pressure on y - axis mole fraction of gas on x - axis
A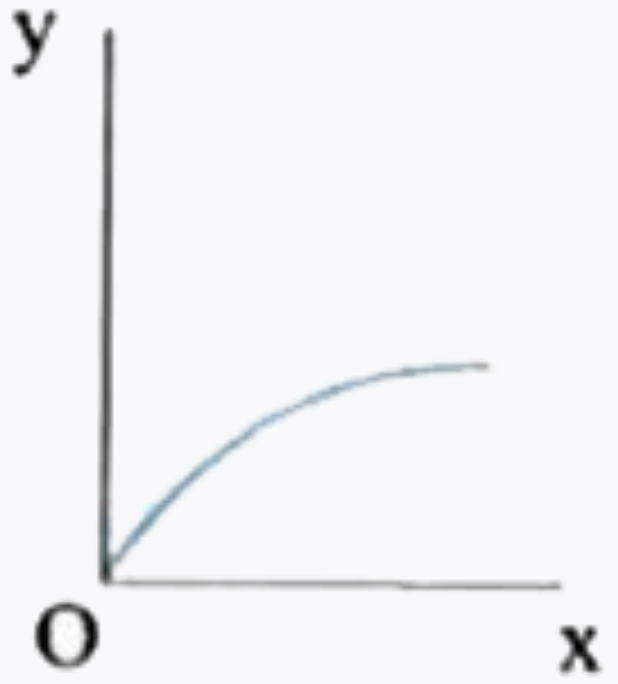 B
B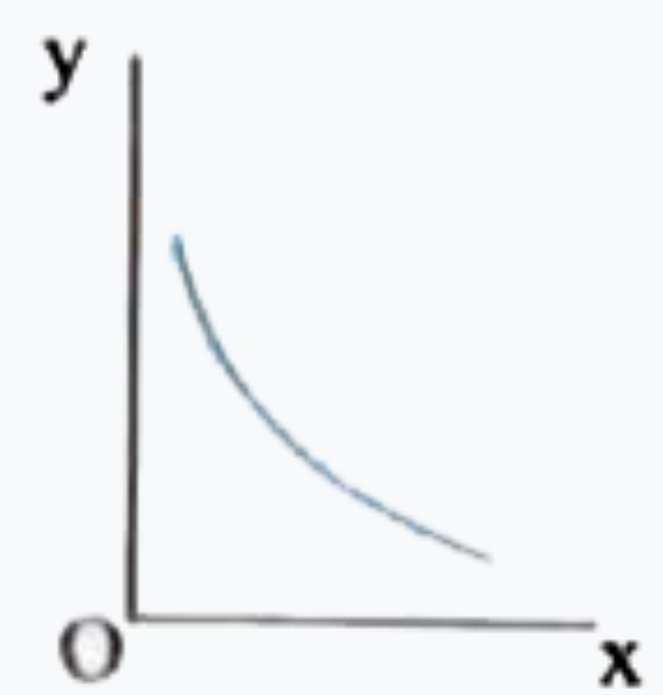 C
C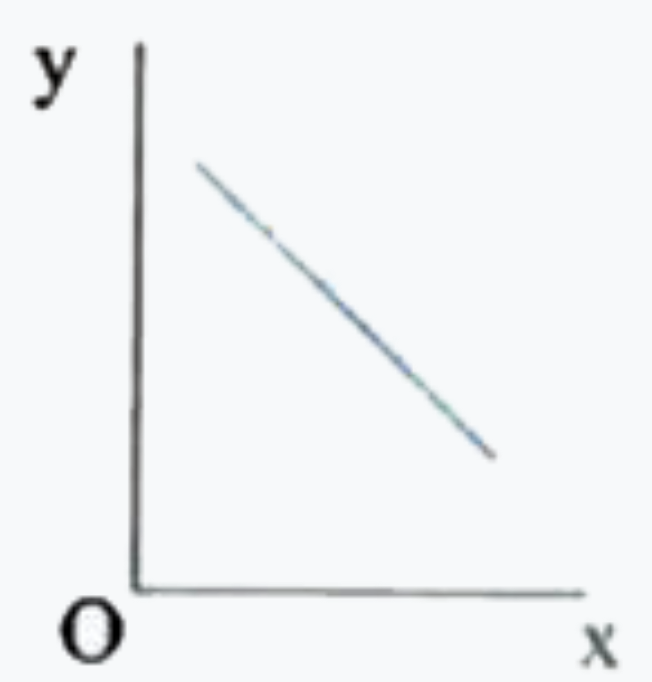 D
D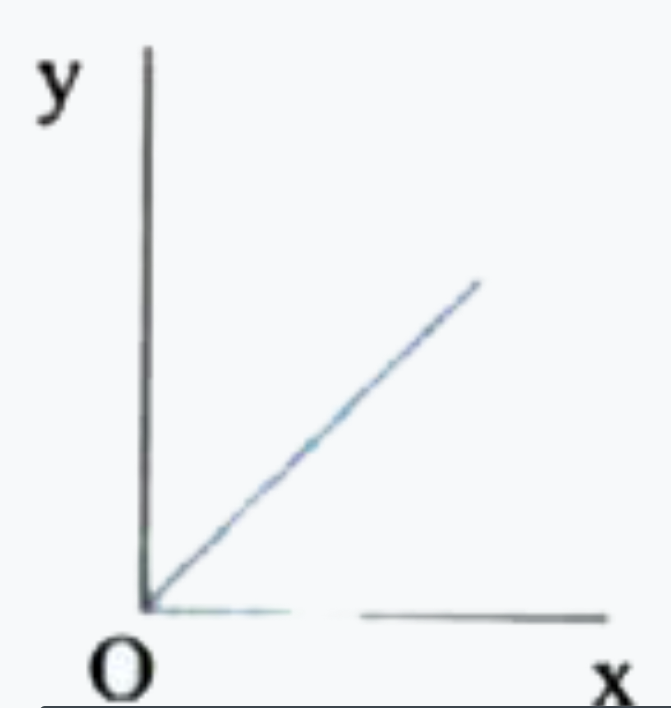
For a real gas obeying van der waal's equation , graph is plotted between PVm (y- axis) and P (x - axis) where Vm is molar volume . Y - intercept the graph is
ARTB(P+aV2)CRTV−bDCannot be determined
Find the area enclosed by the graph of y=loge(x+1),y-axis, and the line y=1
View SolutionFind the area enclosed by the graph of y=loge(x+1),y-axis, and the line y=1
View SolutionThe graph of y=f(x) is shown below.
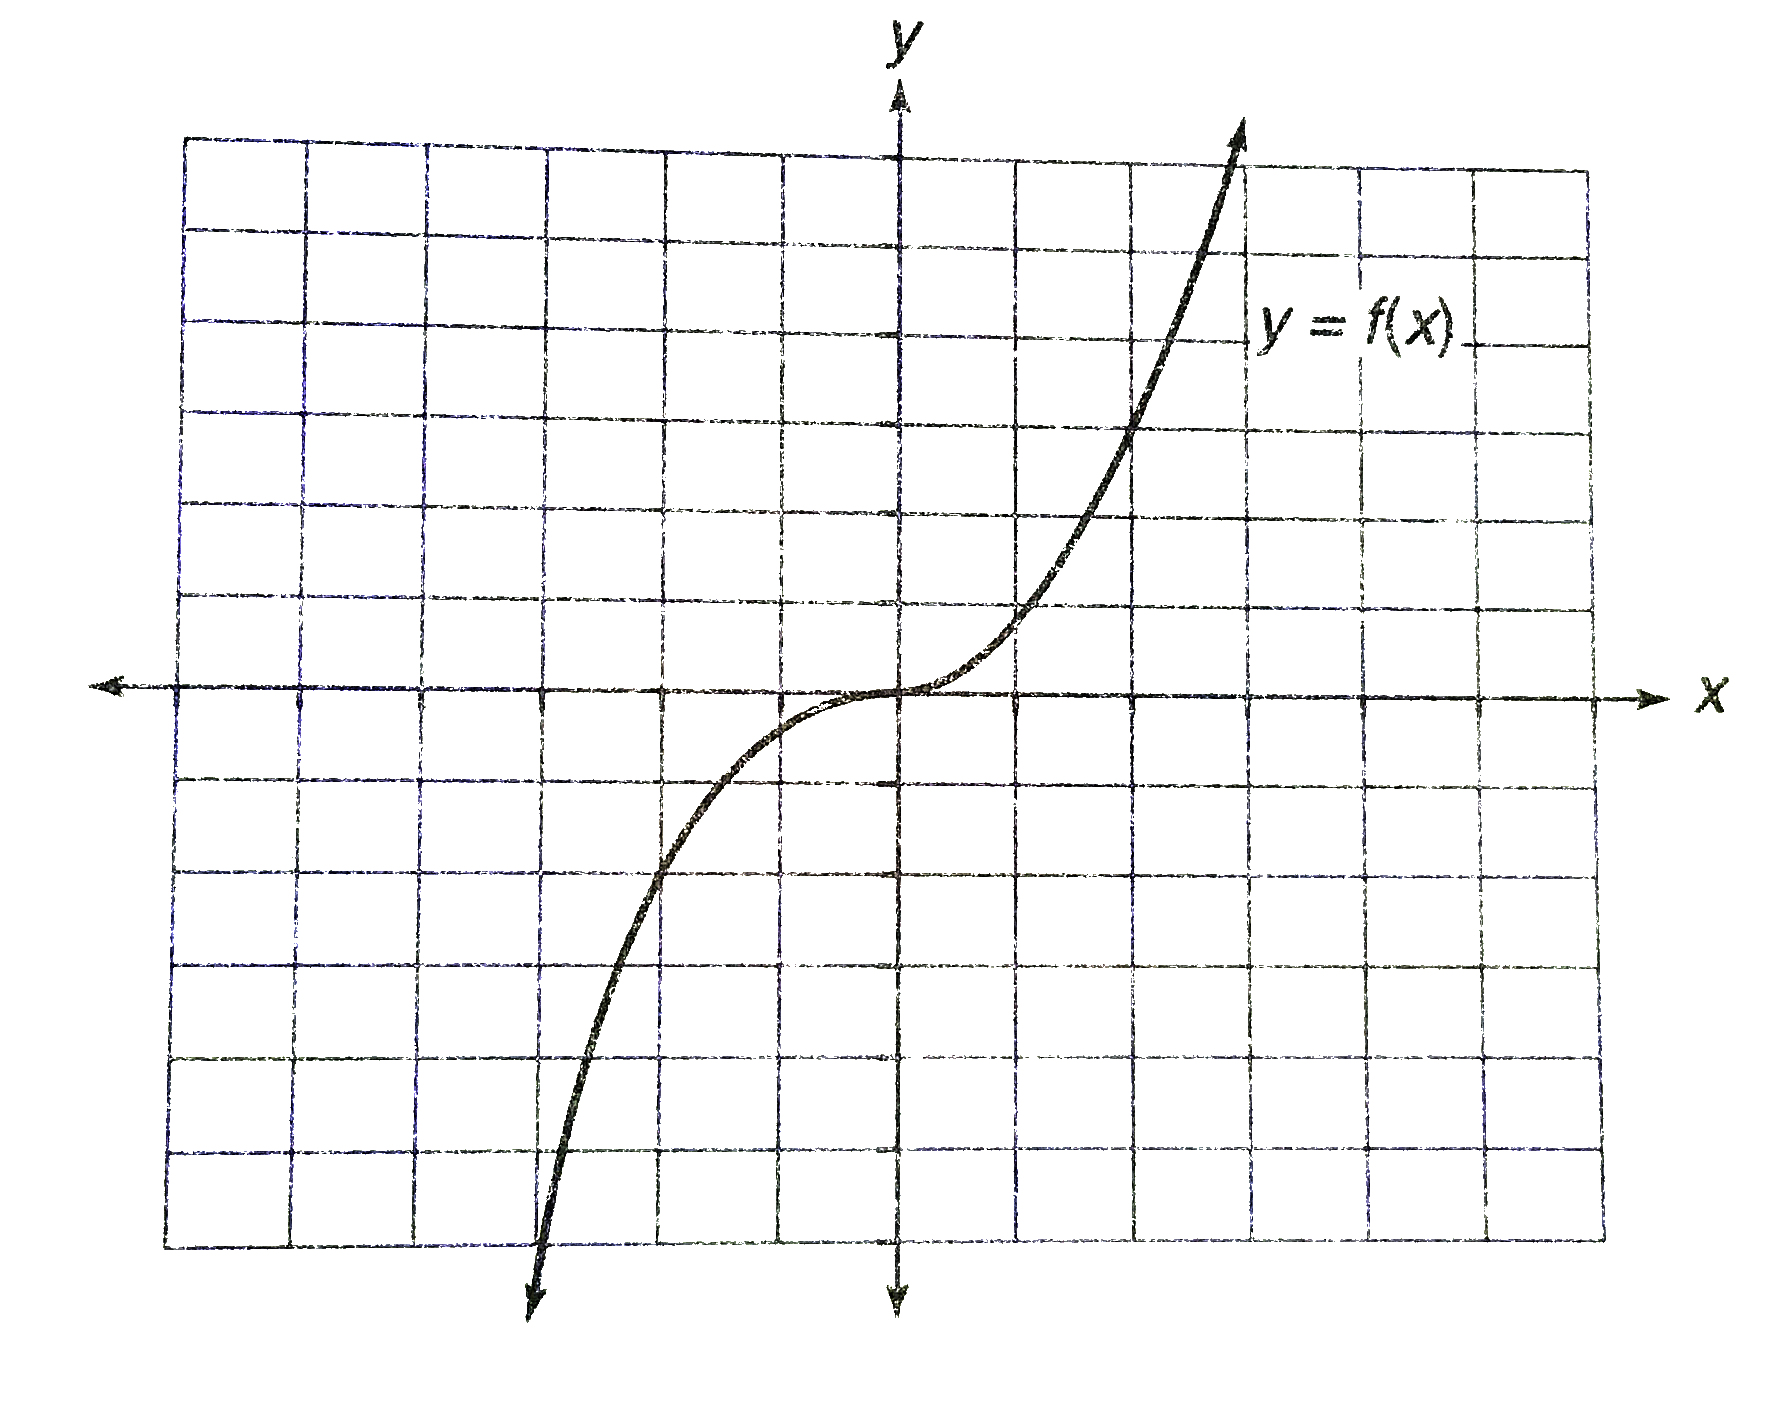
Which of the following could represents the graph of y=f(x−2)+1?
View SolutionThe flux linked with a circuit is given by ϕ=t3+3t−7 . The graph between time (x-axis) and induced emf (y-axis) will be
View SolutionFor a first order reaction, when a graph is plotted between log10([A])0([A])t on y-axis and time (t) on x-axis , slope of the graph of the graph is equal to __________.
View Solution

