For a first order reaction, when a graph is plotted between log10([A])0([A])t on y-axis and time (t) on x-axis , slope of the graph of the graph is equal to __________.
−K
K
−K2.303
K2.303
The correct Answer is:D
Step by step video, text & image solution for For a first order reaction, when a graph is plotted between log^(10)""([A])_(0)/([A])_(t) on y-axis and time (t) on x-axis , slope of the graph of the graph is equal to __________. by Chemistry experts to help you in doubts & scoring excellent marks in Class 12 exams.
Topper's Solved these Questions
Similar Questions
Knowledge Check
- Question 1 - Select One
For a first order reaction, the plot of log[A]tvs t is linear with a
Apositive slope and zero interceptBpositive slope and non zero interceptCnegative slope and zero interceptDnegative slope and non zero intercept - Question 2 - Select One
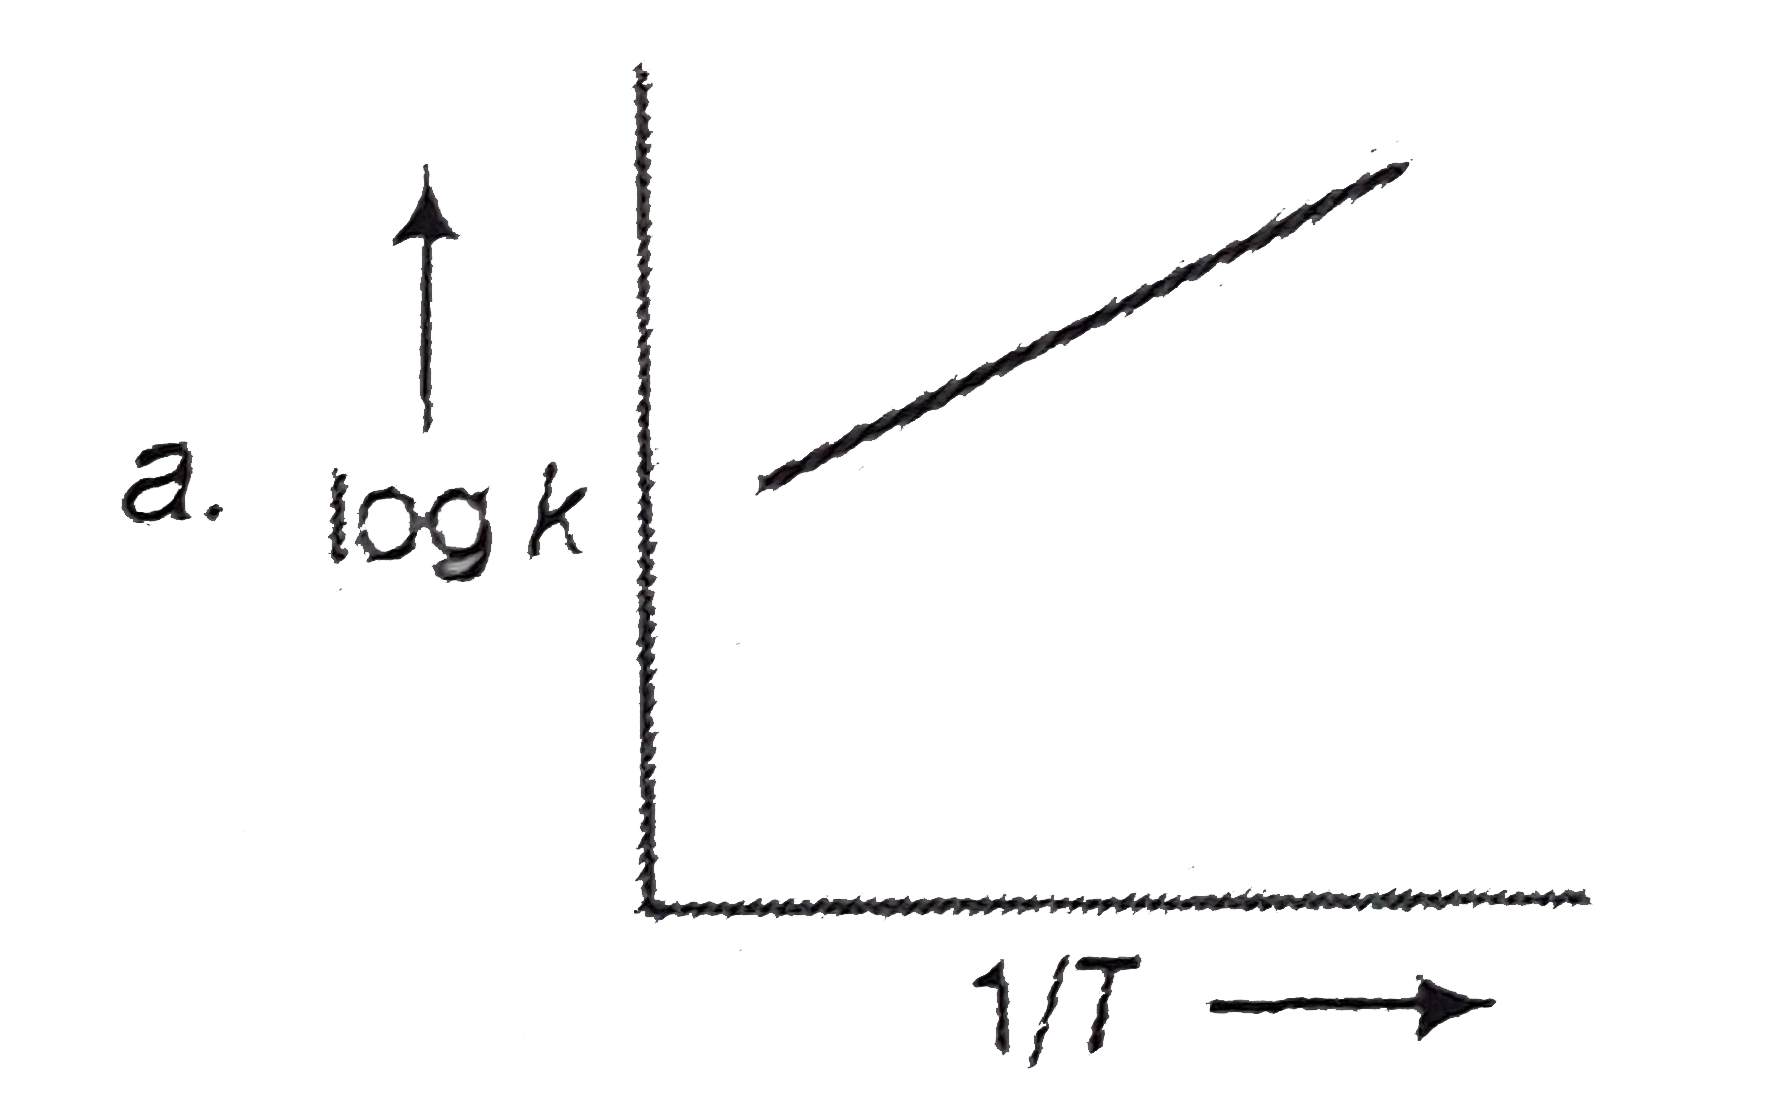
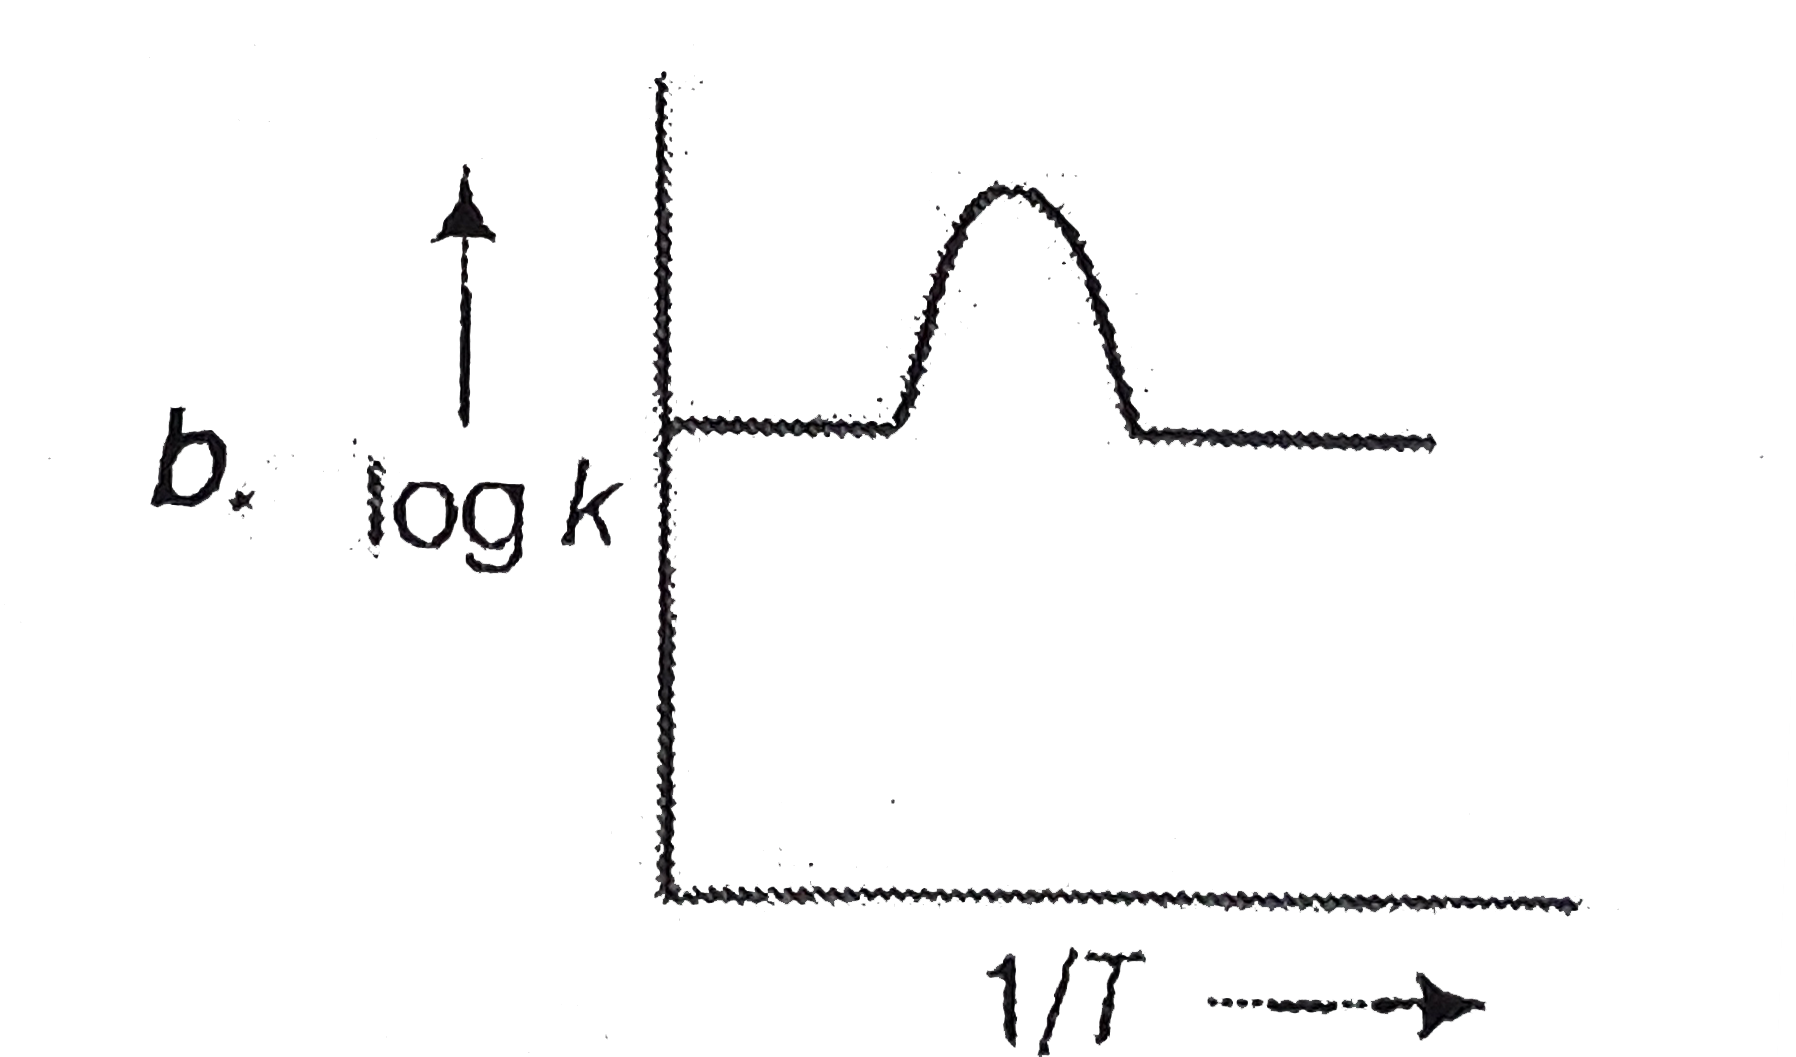
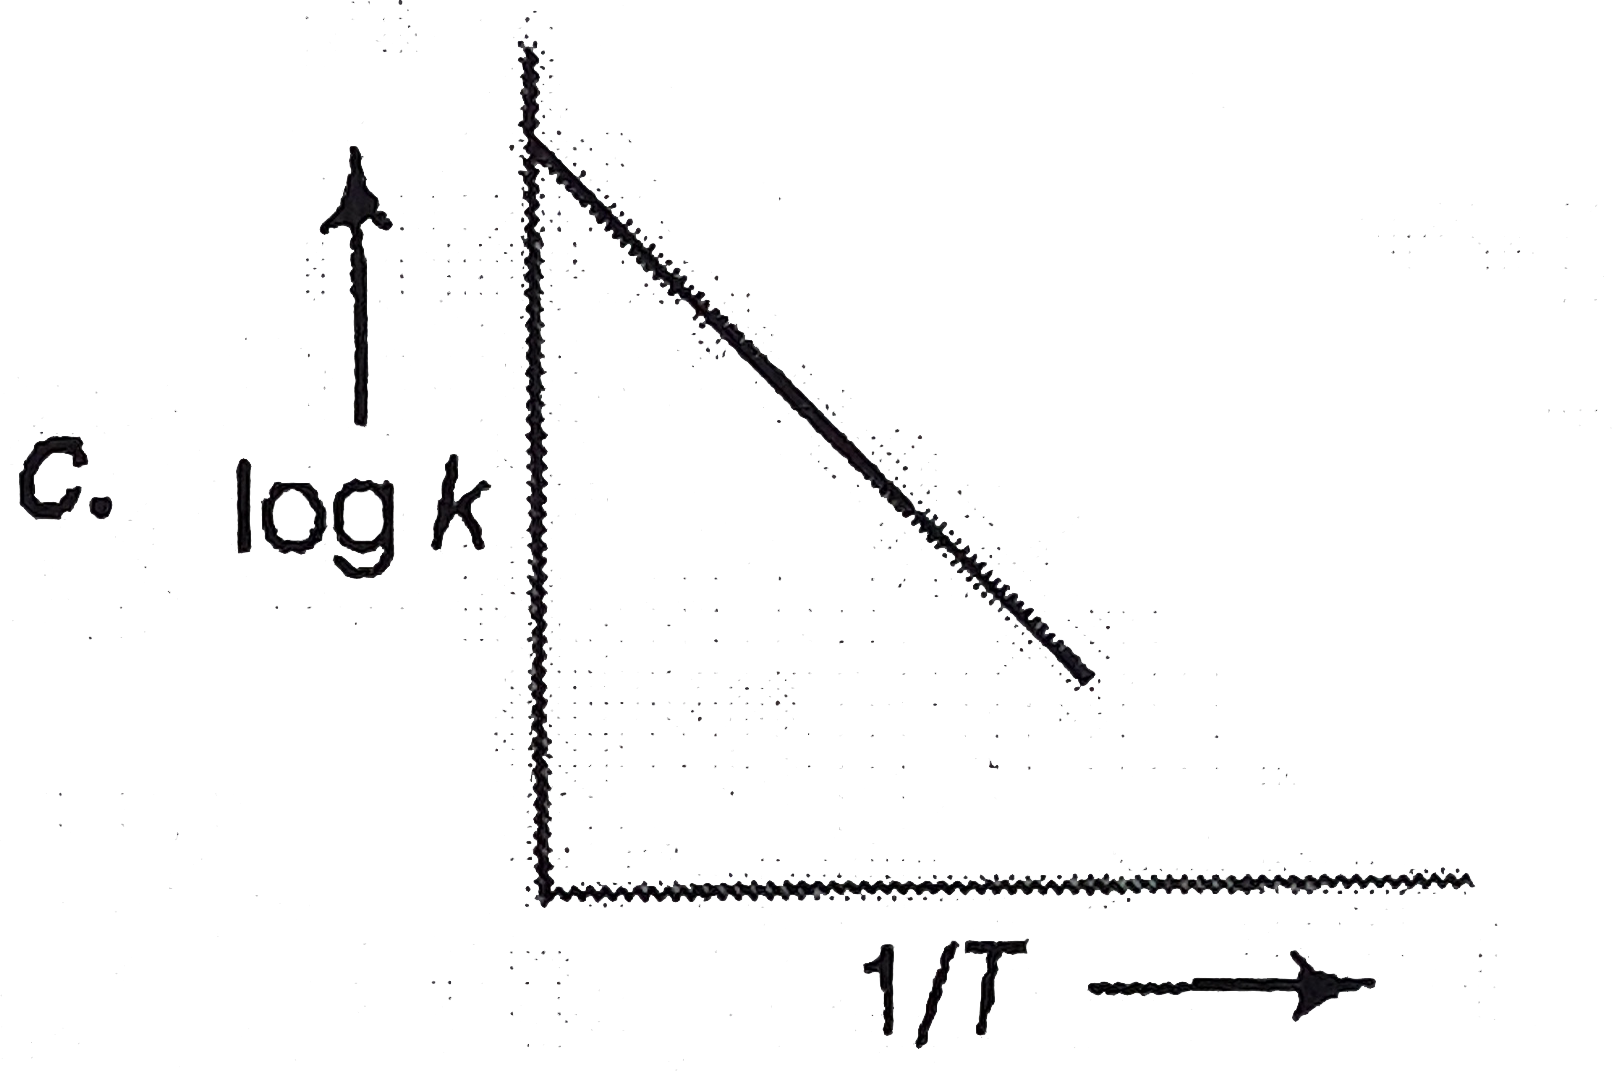
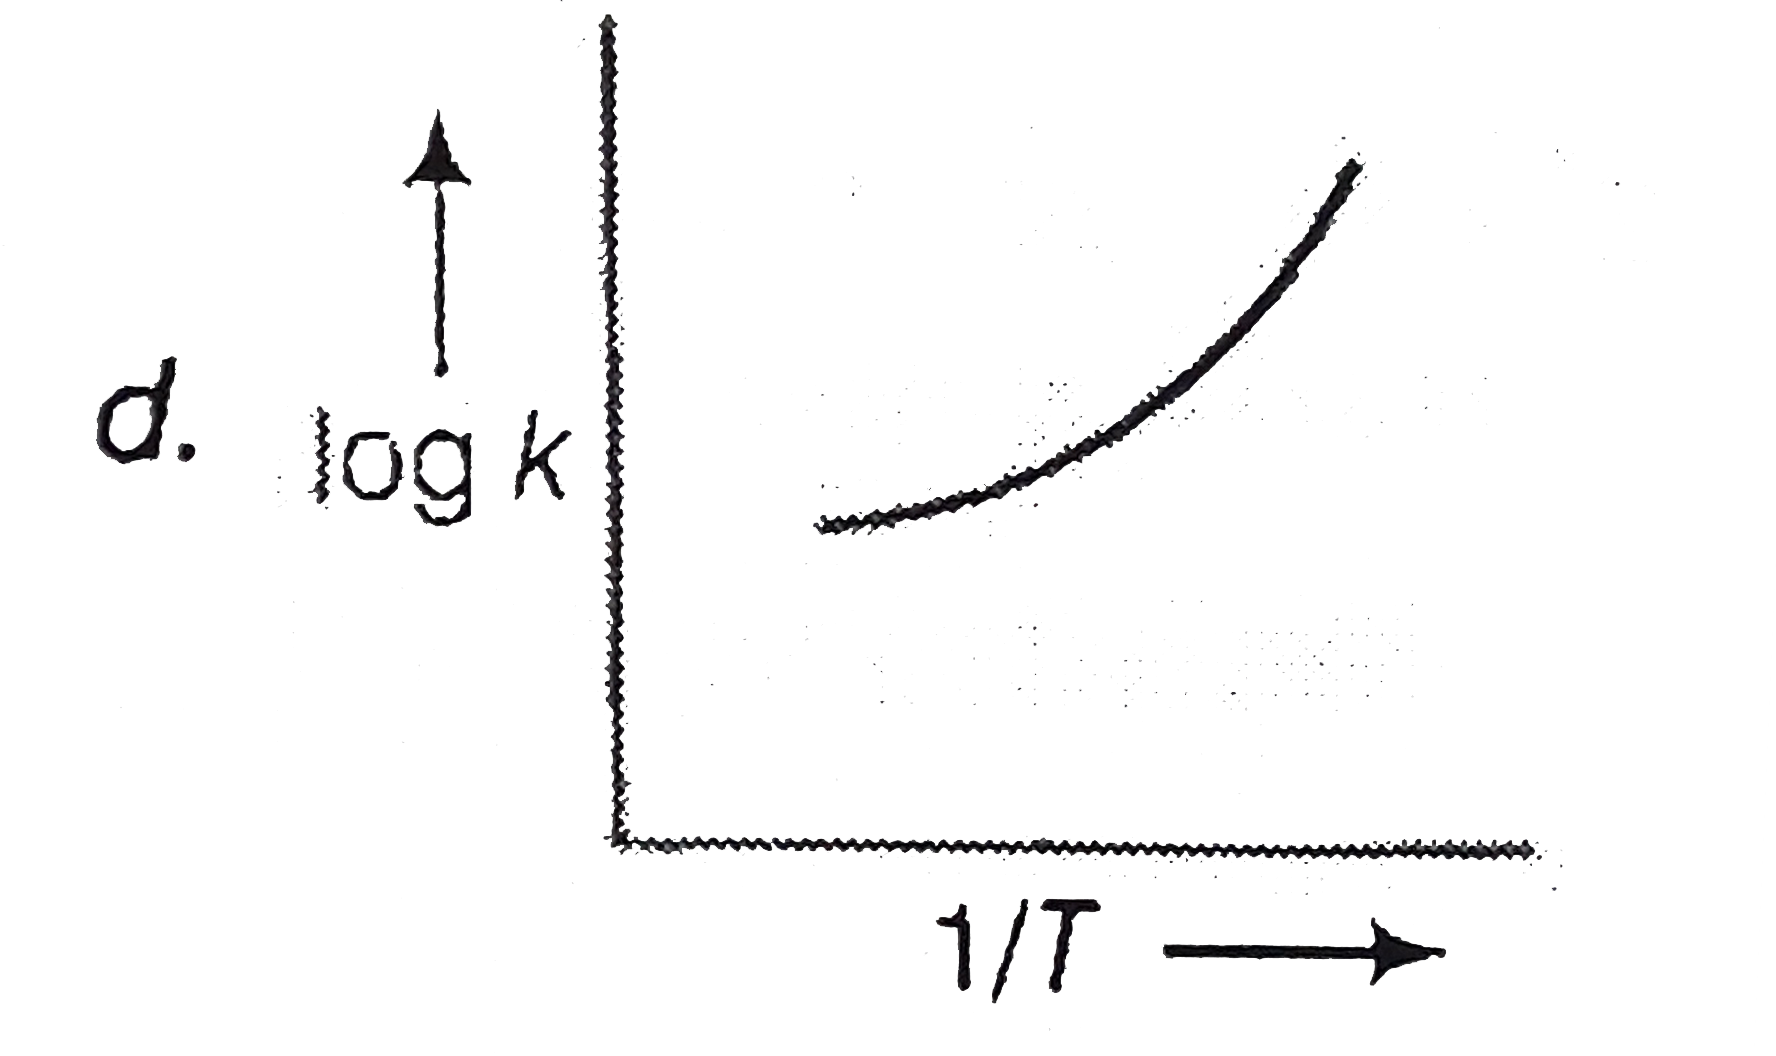
A graph plotted between log k vs 1T is represented by
A B
B C
C D
D
- Question 3 - Select One
For a real gas obeying van der waal's equation , graph is plotted between PVm (y- axis) and P (x - axis) where Vm is molar volume . Y - intercept the graph is
ARTB(P+aV2)CRTV−bDCannot be determined
In the experiment to study relationship between temperture of the body and time if a graph is plotted between log(θ−θ0) taking it along y−axis and time (t) taking along x−along, it is
View SolutionIn a first order reaction , on plotting a graph between t1/2 and concentration of reactant
View SolutionFor a reaction a graph plotted between log(dxdt)andlog(a−x) along y and x axes respectively shows a straight line with a positive slope of 45∘. The order of the reaction is
View SolutionA graph is plotted taking ∘––C along the Y - axis and of along the X - axis .It is a /an
View SolutionIf a graph is plotted between log(a−x) and t, the slope of the straight line is equal to −0.03. The specific reaction rate will be
View Solution

