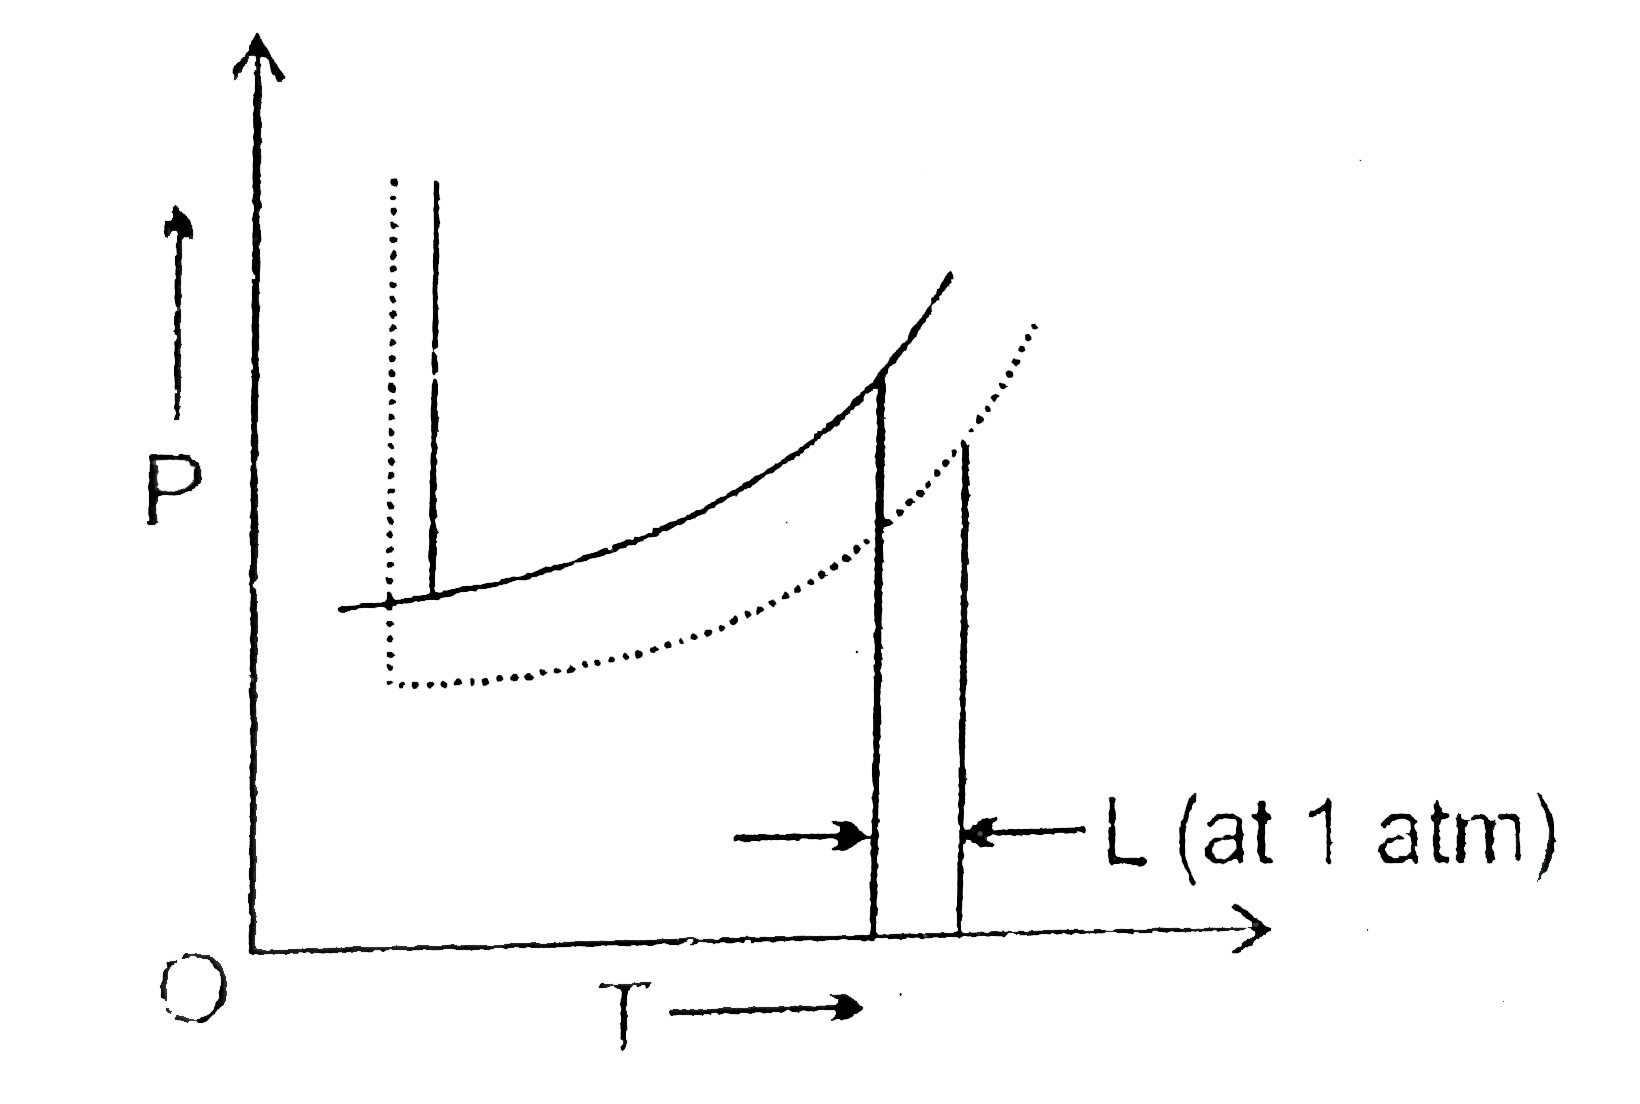
The phase diagrams for the pure solvent (solid lines) and the solution (non-volatile solute, dashed line) are recorded below. The quantity indicated by 'L' in the figure is

A
Δp
B
ΔTf
C
Kb.m
D
Kf.m
Text Solution
The correct Answer is:C
|
Topper's Solved these Questions
- SOLUTIONS BOOK - AAKASH SERIESCHAPTER - SOLUTIONS EXERCISE - Objective Exercise -2
110 Videos
- SOLUTIONS BOOK - AAKASH SERIESCHAPTER - SOLUTIONS EXERCISE - Objective Exercise -3 (PREVIOUS NEEET/AIPMT )
24 Videos
- SOLUTIONS BOOK - AAKASH SERIESCHAPTER - SOLUTIONS EXERCISE - Subjective Exercise-3 (Problems)
7 Videos
- SOLIDS STATEBOOK - AAKASH SERIESCHAPTER - SOLIDS STATEEXERCISE - PRACTICE EXERCISE
63 Videos
- STATES OF MATTER BOOK - AAKASH SERIESCHAPTER - STATES OF MATTER EXERCISE - ADDITIONAL PRACTICE EXERCISE -PRACTICE SHEET (ADVANCED) (LINKED COMPREHENSION TYPE QUESTIONS) (PASSAGE- IV)
2 Videos
Similar Questions
Knowledge Check
The phase diagrams for the pure solvent (solid lines) and the solution (non-volatile solute, dashed line) are recorded below:

The quantity indicated by L in the figue is :AΔPBΔTfCKbmDKfmWhen non-volatile solute is assed to a pure solvent, the:
Avapour pressure of the solution becomes lower than the vapour pressure of the pure solventBrate of evaporation of solvent is reducedCsolute does not affect the rate of condensationDnone of thesePartial pressure of solvent in solution of non-volatile solute is given by equation.
Ap=x2p∘Bp∘=xpCp=x1p∘Dp∘=x1p
Why is vapour pressure of solvent lowered on adding non-volatile solute to it ?
View SolutionWhy is boiling point of a solvent elevated upon the addition of a non-volatile solute ?
View SolutionThe mole fraction of the solvent in the solution of a non-volatile solute is 0.980. The relative lowering of vapour pressure is :
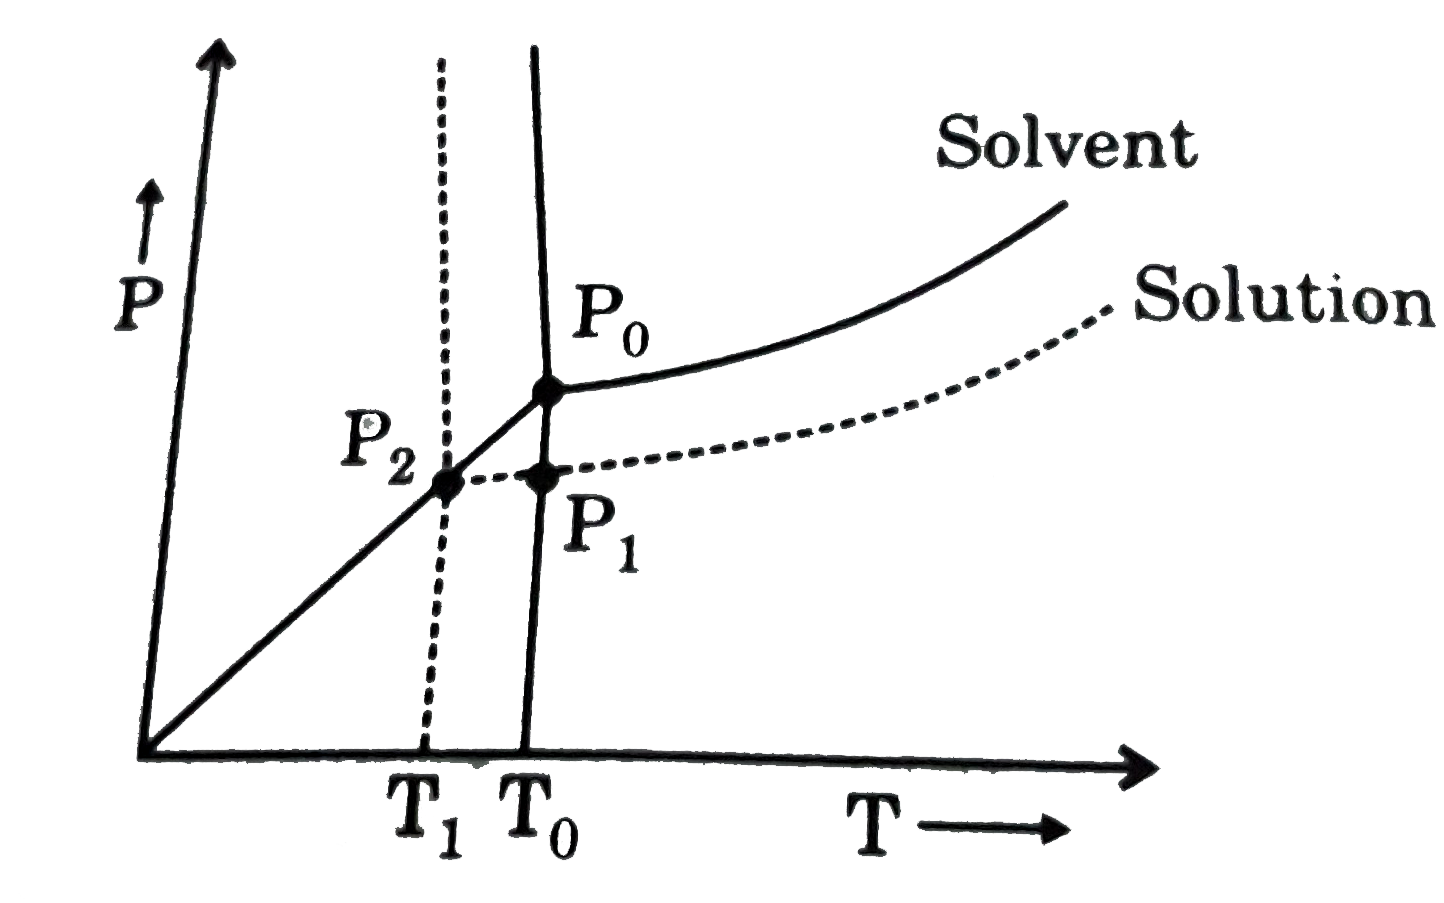
View SolutionFrom the phase diagram of water and an aqueous solution containing non-volatile solute, identify the incorrect option.

View SolutionCamphor is used as solvent to determine the molecular weight of non volatile solute because:
View Solution
