The variation of ^m of acetic acid with concen-tration is correctly represented by


The correct Answer is:C
Topper's Solved these Questions
- ELECTROCHEMISTRY BOOK - AAKASH SERIESCHAPTER - ELECTROCHEMISTRY EXERCISE - PRACTICE SHEET -2 ( LINKED COMPREHENSION TYPE QUESTIONS (PASSAGE-I))
3 Videos
- ELECTROCHEMISTRY BOOK - AAKASH SERIESCHAPTER - ELECTROCHEMISTRY EXERCISE - PRACTICE SHEET -2 ( LINKED COMPREHENSION TYPE QUESTIONS (PASSAGE-II))
3 Videos
- ELECTROCHEMISTRY BOOK - AAKASH SERIESCHAPTER - ELECTROCHEMISTRY EXERCISE - PRACTICE SHEET -1 ( INTEGER ANSWER TYPE QUESTIONS)
6 Videos
- DILUTE SOLUTIONSBOOK - AAKASH SERIESCHAPTER - DILUTE SOLUTIONSEXERCISE - EXERCISE - 1.2
55 Videos
- ELEMENTS OF D - BLOCKBOOK - AAKASH SERIESCHAPTER - ELEMENTS OF D - BLOCKEXERCISE - EXERCISE - 5.2
33 Videos
Similar Questions
In order to prepare a buffer solution of pH 5.74, sodium acetate is added to acetic acid. If the concentration of acetic acid in the buffer is _______ M, the concentration of sodium acetate in the buffer is M. (Round off to the Nearest Integer).
[Given : pKa (acetic acid) = 4.74]
View SolutionWhich one among the following sequences of water bodies, from lower to higher salinity concen- tration, is correct?
View Solution
Knowledge Check
The variation of ∧m of acetic acid with concentration is correctly represented by
A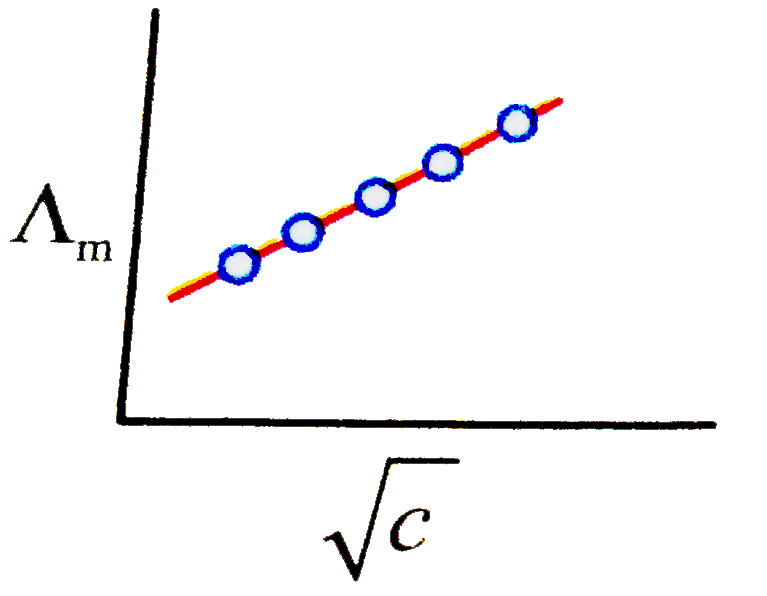 B
B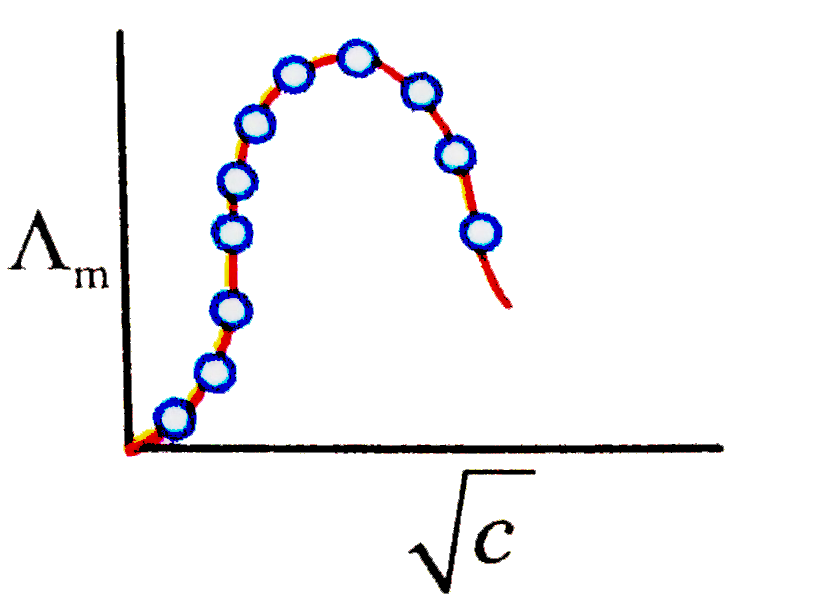 C
C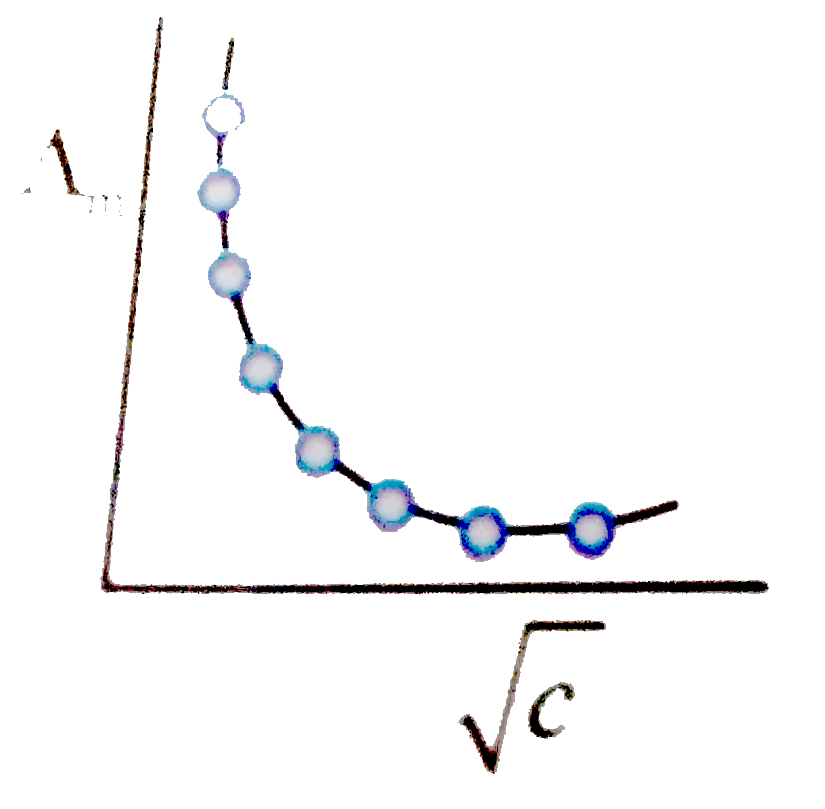 D
D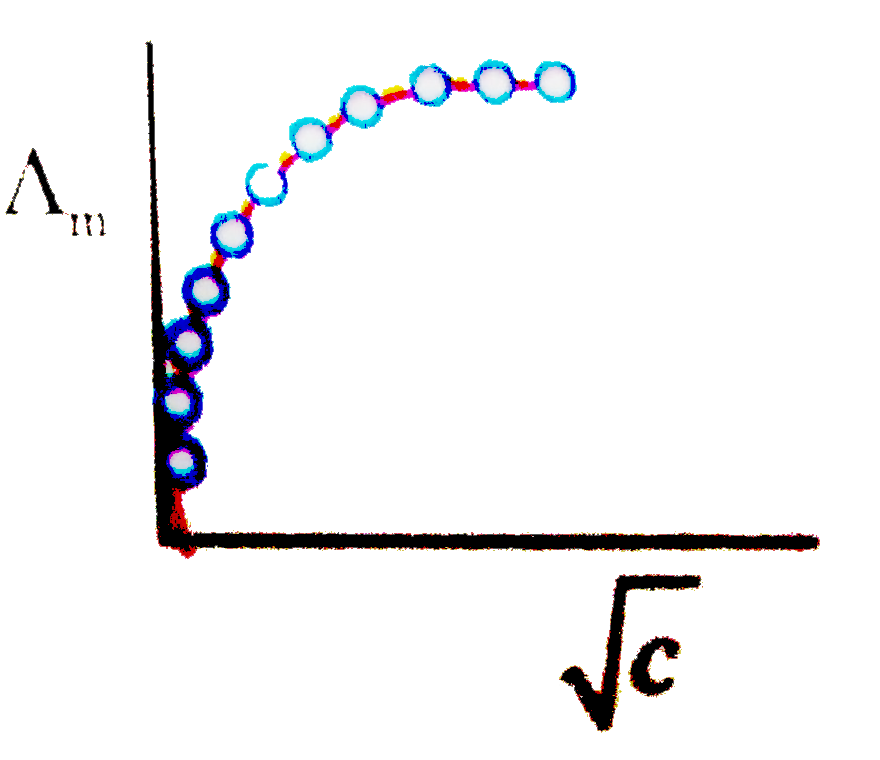
pH of 0.1M Acetic acid is
ALess than 1BGreater than 1C1D7The variation of temperature of a liquid with time is represented correctly by (figure)
A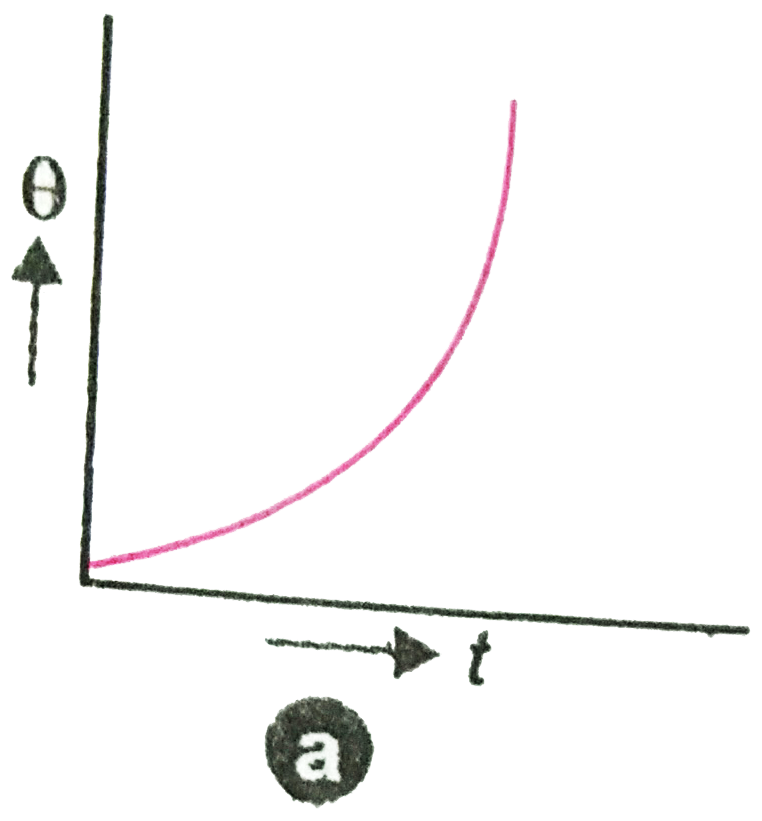 B
B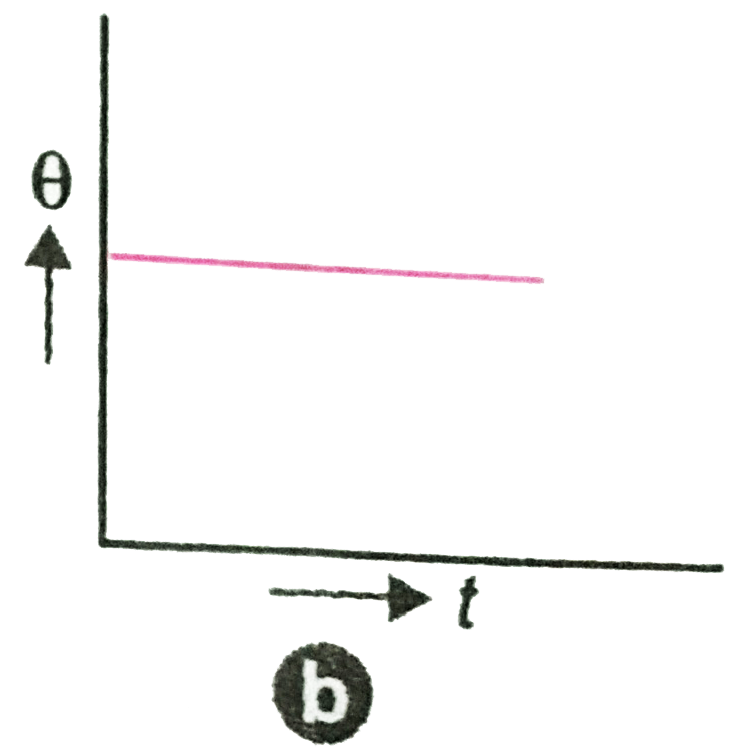 C
C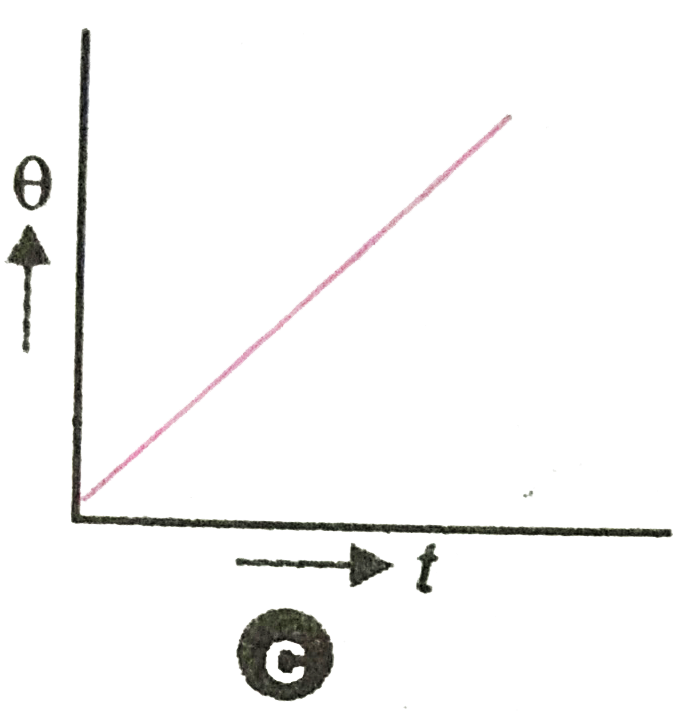 D
D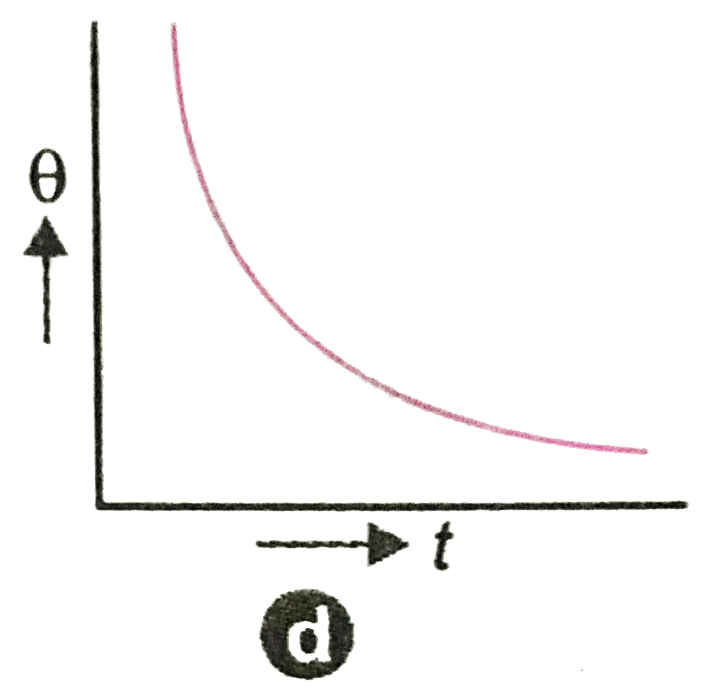
Which of the following graph correctly represents the variation of molar conductance (Δm) with dilution for a strong electrolyte ?
View SolutionThe given graph shows the variation of velocity with displacement. Which one of the graphs given below correctly represents the variation of acceleration with displacement ?

View SolutionThe pH of 0.1 M acetic acid is 3, the dissociation constant of acid will be
View SolutionAssertion :- Parathormone & thyrocalcitonin are antagonist to each other.
Reason:- Parathormone maintains Ca+2 concen tration in blood and it's receptors are present in osteoclast cells.
View SolutionWhich of the following graph correctly represents the variation of molar conductance (Δm) with dilution for a strong electrolyte ?
View Solution

