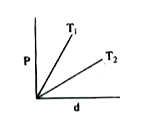
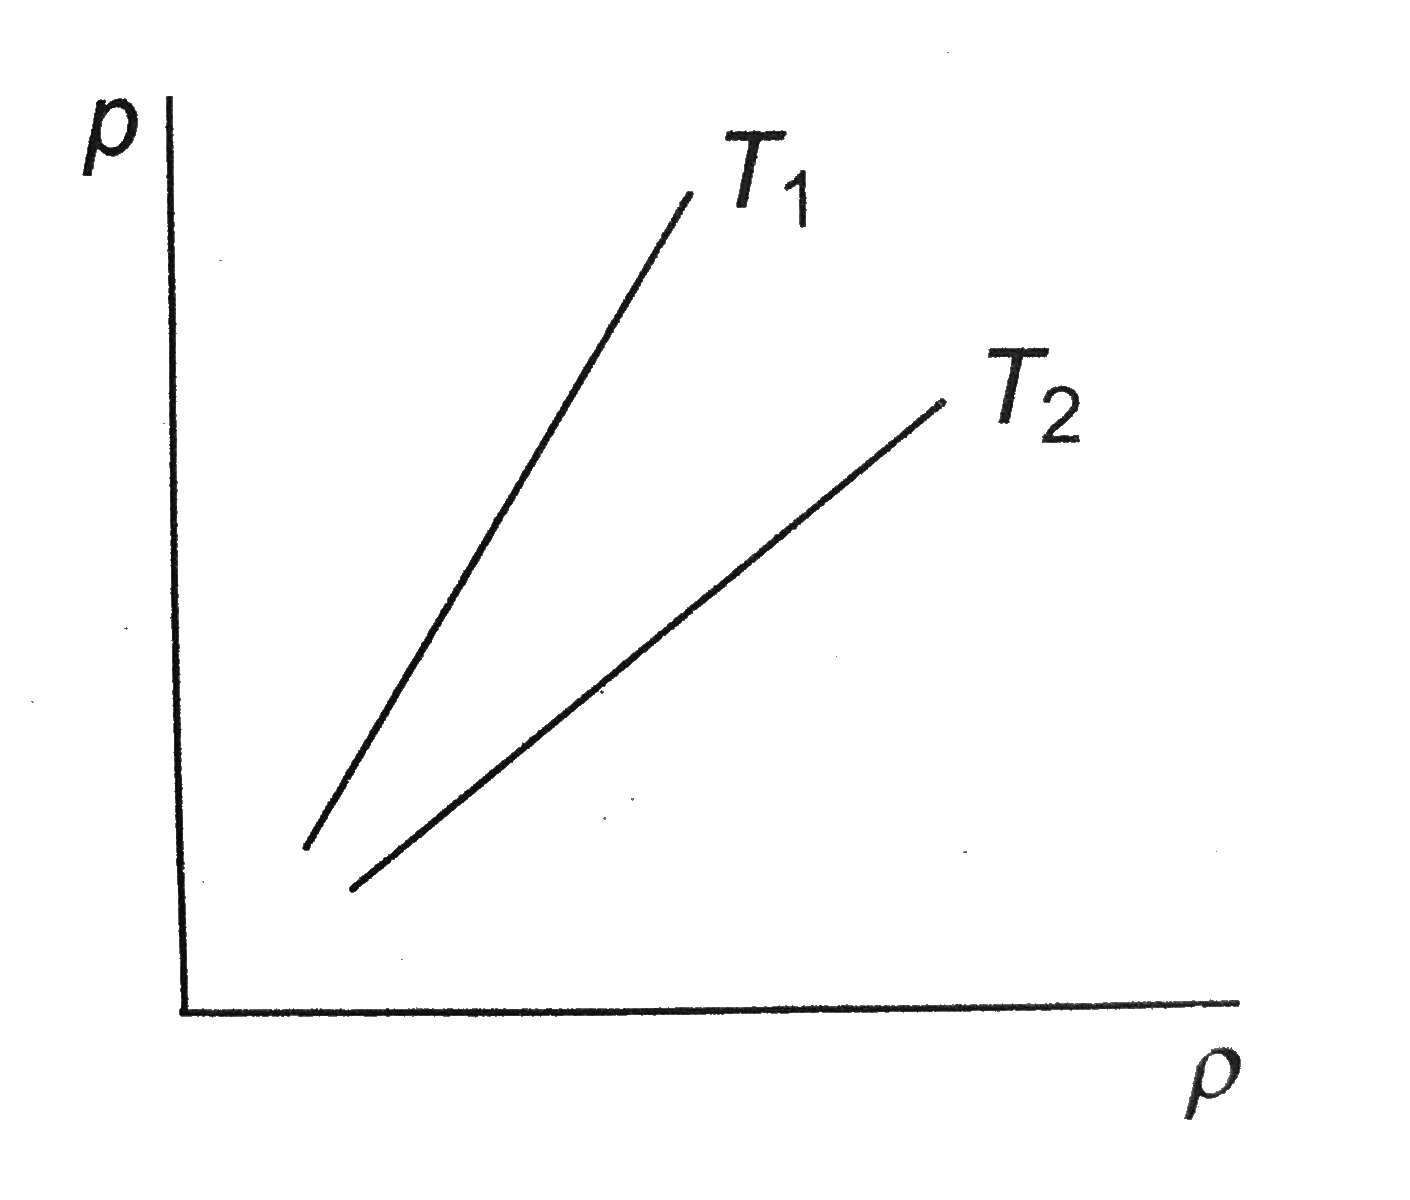
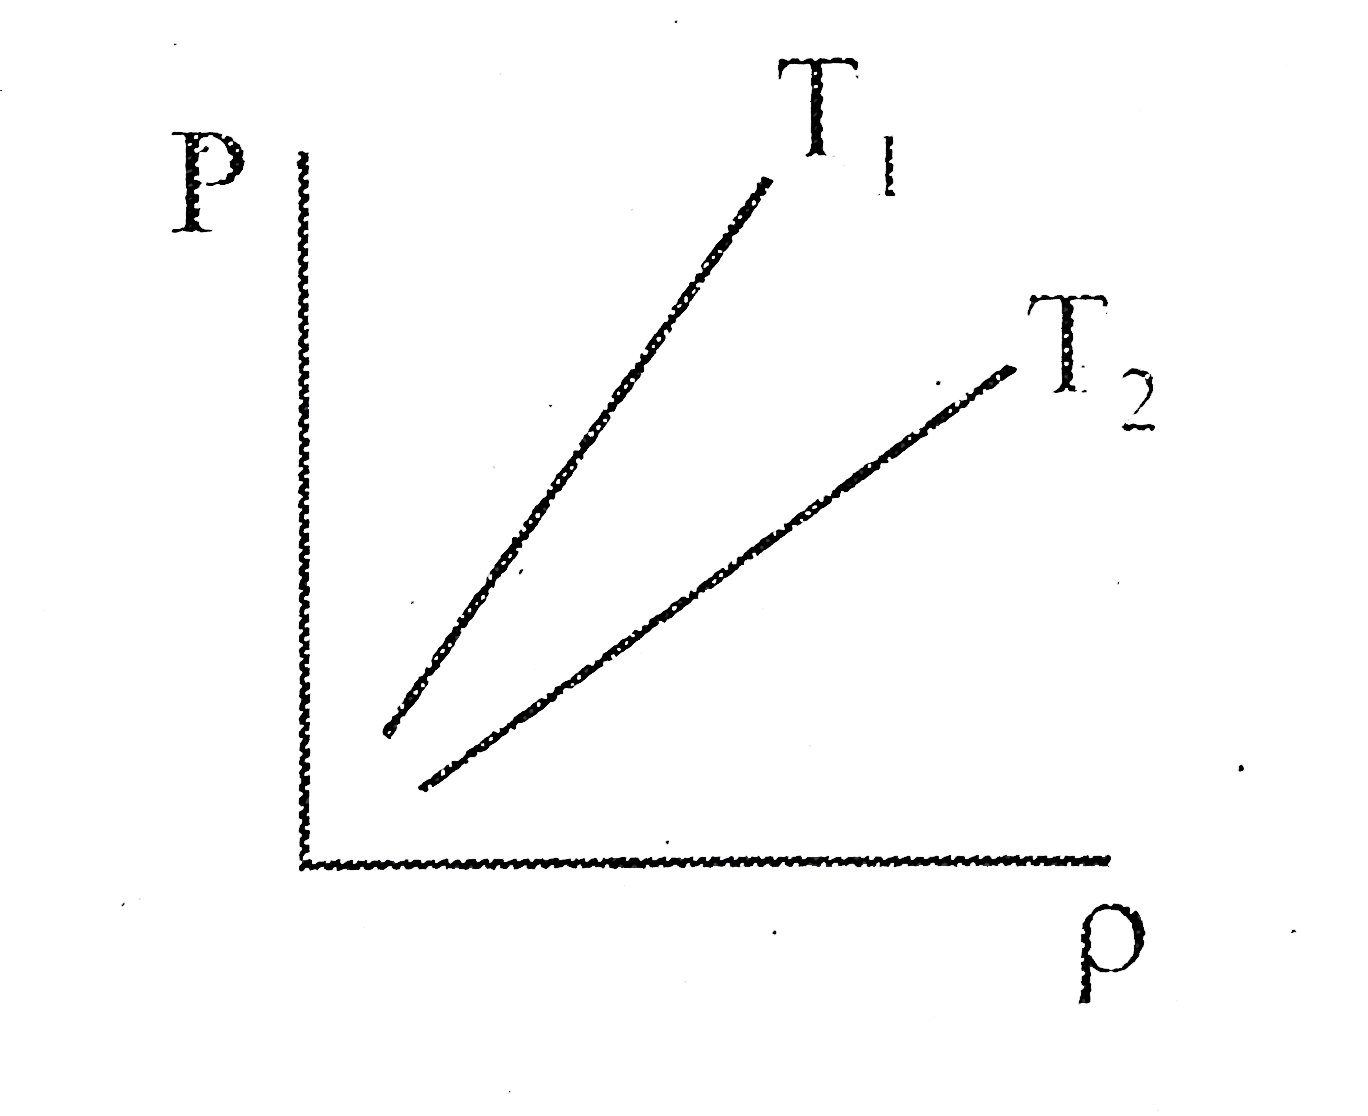
Diagram shows a graph between pressure and density for an ideal gas at two temperatures T1andT2 which is correct
 Solution in Telugu
T1>T2
T=T2
T1>T2
None
The correct Answer is:A
At constant, d,P1>P2 (from graph) ⇒T1>T2 .
Topper's Solved these Questions
- STATES OF MATTERBOOK - AAKASH SERIESCHAPTER - STATES OF MATTEREXERCISE - LECTURE SHEET - EXERCISE - I (LEVEL - II ADVANCED)(MORE THAN ONE CORRECT ANSWER TYPES QUESTIONS)
5 Videos
- STATES OF MATTERBOOK - AAKASH SERIESCHAPTER - STATES OF MATTEREXERCISE - LECTURE SHEET - EXERCISE - I (LEVEL - II ADVANCED)(LINKED COMPREHENSION TYPES QUESTIONS)
3 Videos
- STATES OF MATTERBOOK - AAKASH SERIESCHAPTER - STATES OF MATTEREXERCISE - OBJECTIVE EXERCISE -3
19 Videos
- SATURATED HYDROCARBONSBOOK - AAKASH SERIESCHAPTER - SATURATED HYDROCARBONSEXERCISE - QUESTIONS FOR DESCRIPTIVE ANSWERS
10 Videos
- STOICHIOMETRYBOOK - AAKASH SERIESCHAPTER - STOICHIOMETRYEXERCISE - QUESTIONS FOR DESCRIPTIVE ANSWERS
59 Videos
Similar Questions
The following statements are correct
View SolutionA 10 cm column of air is trapped by a column of mercury, 8 cm long, in a capillary tube horizontally fixed as shown below, at 1 atm pressure. When the tube is held at certain angle θ∘ with open end up, the weight of Hg is borne partially by the gas. Vertical Height of Hg is a measure of additional pressure on gas.
 The length of air column, when the tube is fixed vertically at the same temperature with open end up is .
View SolutionVan der Waal's real gas, acts as an ideal gas, at which conditions
View SolutionWhy boiling and melting points of hydrocarbons are low ?
View SolutionDistinguish between element and compound?
View SolutionFigure shows graphs of pressure vs density for an ideal gas at two temperature T1andT2. Which of the following is correct?

View SolutionFigure shows graphs of pressure versus density for an ideal gas at two temperatures T_(1) and T_(2) Which is correct ? .
View SolutionThe adjoining figure shows graphs of pressure and volume of a gas at two temperature T_1 and T_2 Which of the following inferences is correct?
View SolutionFigure shows graphs of pressure vs density for an ideal gas at two temperature T1 and T2 . Which of the following is correct ?

View SolutionWhich of the following shows the correct relationship between the perssure and density of an ideal gas constant temperature ?
View SolutionWhich of the following shows the correct relationship between the pressure and density of an ideal gas at constant temperature ?
View SolutionWhich of the following shows the correct relationship between the pressure and density of an ideal gas at constant temperature ?
View SolutionFigure shows graphs of pressure versus density for an ideal gas at two temperatures T1 and T2 Then

View SolutionDiagram shows a graph between pressure and density for an ideal gas at two temperatures T1andT2 which is correct

View SolutionPressure (P) vs. density (D) curve for an ideal gas at two different temperatures T_1 and T_2 is shown below . Identify the correct statement about T_1 and T_2 .
View Solution
