CBSE|Bar Graphs and Double Bar Graphs
Step by step video & image solution for CBSE|Bar Graphs and Double Bar Graphs by Maths experts to help you in doubts & scoring excellent marks in Class 7 exams.
Updated on:21/07/2023Similar Questions
Bar Graph|Double Bar Graph|Histogram|Practice Problem
View SolutionBar Graph|Double Bar Graph|Histogram|Practice Problem
View SolutionConsider this data collected from a survey of a colony

Draw a double bar graph choosing an apropriate scale
What do you infer from the bar graph
View SolutionInterpretation of BAR Graphs
View SolutionThe following table gives the average temperatures, during the year 2006 and 2007. Draw a double bar graph for the given data.

View SolutionState True or False:
Pictographs and bar graphs are pictorial representations of the numerical data.
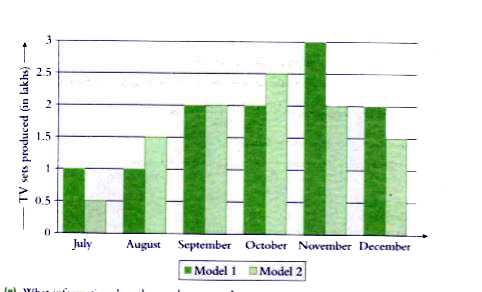
View SolutionTwo different models of TV sets are produced in a factory and are given below as a double bar graph. Read the data and answer the following questions:

What information does the graph represent?
View SolutionConstruct a bar graph
View SolutionConstruction of Bar graphs on Graph paper
View SolutionIn bar graphs, the width of the bar represents the value of the item. (True/False)
View Solution
