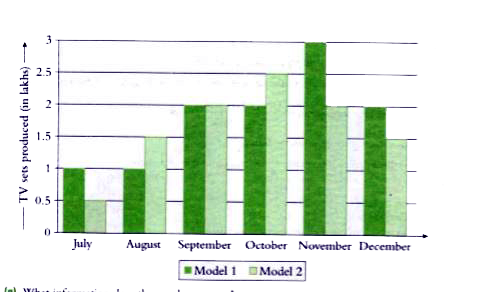
Two different models of TV sets are produced in a factory and are given below as a double bar graph. Read the data and answer the following questions:
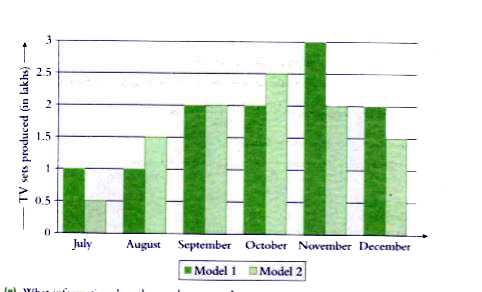
What information does the graph represent?
The correct Answer is:Two different types of TV secs are produced each month in a factory.
Step by step video & image solution for Two different models of TV sets are produced in a factory and are given below as a double bar graph. Read the data and answer the following questions: What information does the graph represent? by Maths experts to help you in doubts & scoring excellent marks in Class 7 exams.
Updated on:21/07/2023Similar Questions
Two different models of TV sets are produced in a factory and are given below as a double bar graph. Read the data and answer the following questions :
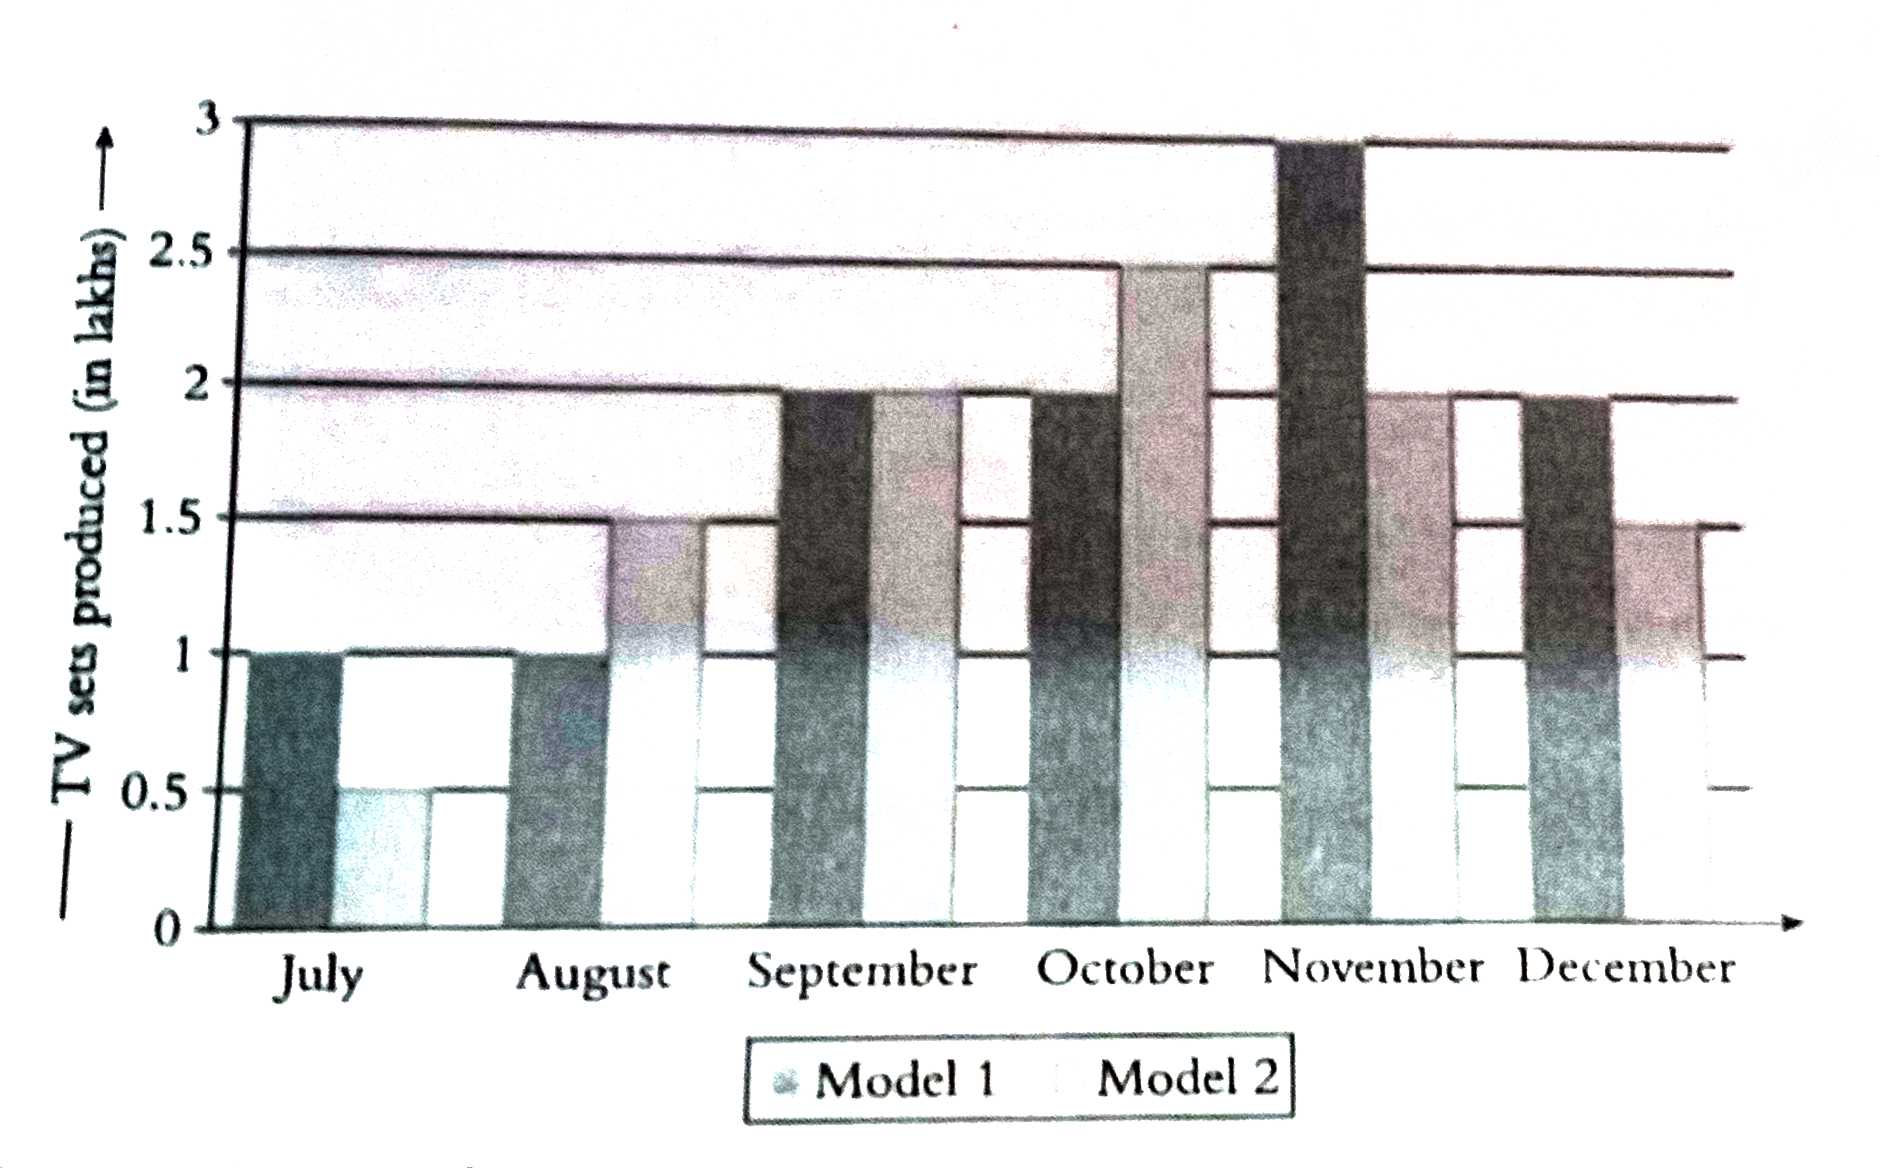
(A) What information does the graph represent ?
(b) In which month, both the models of TV sets produced are equal ?
(c) In which month, both the model of TV sets produced are maximum ?
(d) In which month, both the models of TV sets produced are minimum and how many are they ?
View SolutionTwo different models of TV sets are produced in a factory and are given below as a double bar graph. Read the data and answer the following questions:
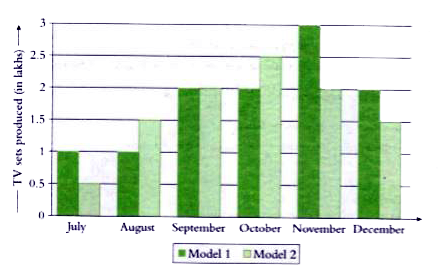
In which month, both the models of TV sets produced are equal?
View SolutionTwo different models of TV sets are produced in a factory and are given below as a double bar graph. Read the data and answer the following questions:
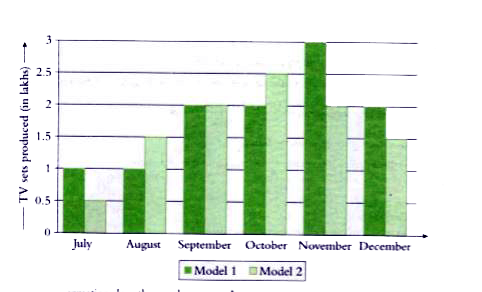
In which month, both the models of TV sets produced are minimum and how many are they?
View SolutionTwo different models of TV sets are produced in a factory and are given below as a double bar graph. Read the data and answer the following questions:
In which month, both the models of TV secs produced are maximum?
View SolutionRead the bar graph and answer the following questons.
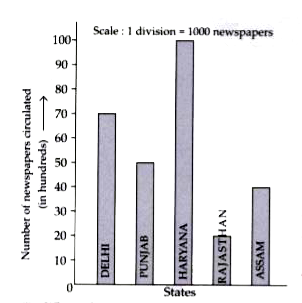
What information is given by graph ?
View SolutionRead the graph and answer the following questions
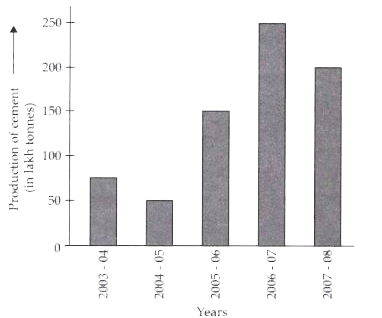
What information is conveyed by the bar graph
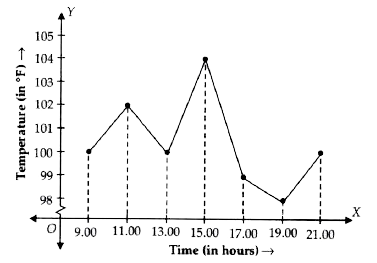
View SolutionObserve the graph and answer the following questions.
The information given by the graph is:
View SolutionRead the bar graph given below and answer the following questions:
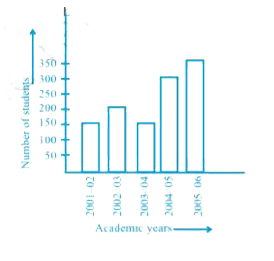
What information is given by the þar graph?
View SolutionRead the graph and answer the following questions
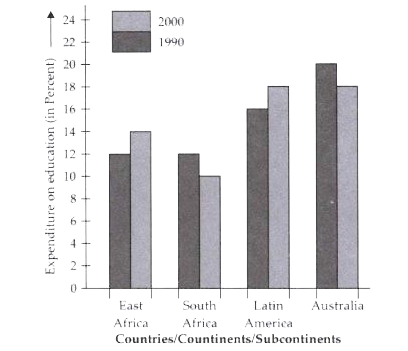
Give a suitable title to bar graph
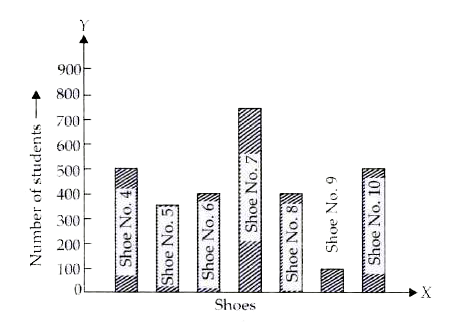
View SolutionRead the bar graph shown in figure and answer the following questions.
What is the information given by the bar graph?
View Solution
