The given graph represents

x∈(−∞,5)
x∈(−∞,5]
x∈[5,∞)
x∈(5,∞)
The correct Answer is:D
The given graph represents all the values greater then 5 except x = 5 on the real line
So, x∈(5,∞).
Topper's Solved these Questions
- BOOK - NCERT EXEMPLAR ENGLISHCHAPTER - LINEAR INEQUALITIESEXERCISE - Long Answer Type Question6videos
LINEAR INEQUALITIES
- BOOK - NCERT EXEMPLAR ENGLISHCHAPTER - LIMITS AND DERIVATIVES EXERCISE - FILLERS4videos
LIMITS AND DERIVATIVES
- BOOK - NCERT EXEMPLAR ENGLISHCHAPTER - MATHEMATICAL REASONING EXERCISE - OBJECTIVE TYPE QUESTIONS21videos
MATHEMATICAL REASONING
Similar Questions
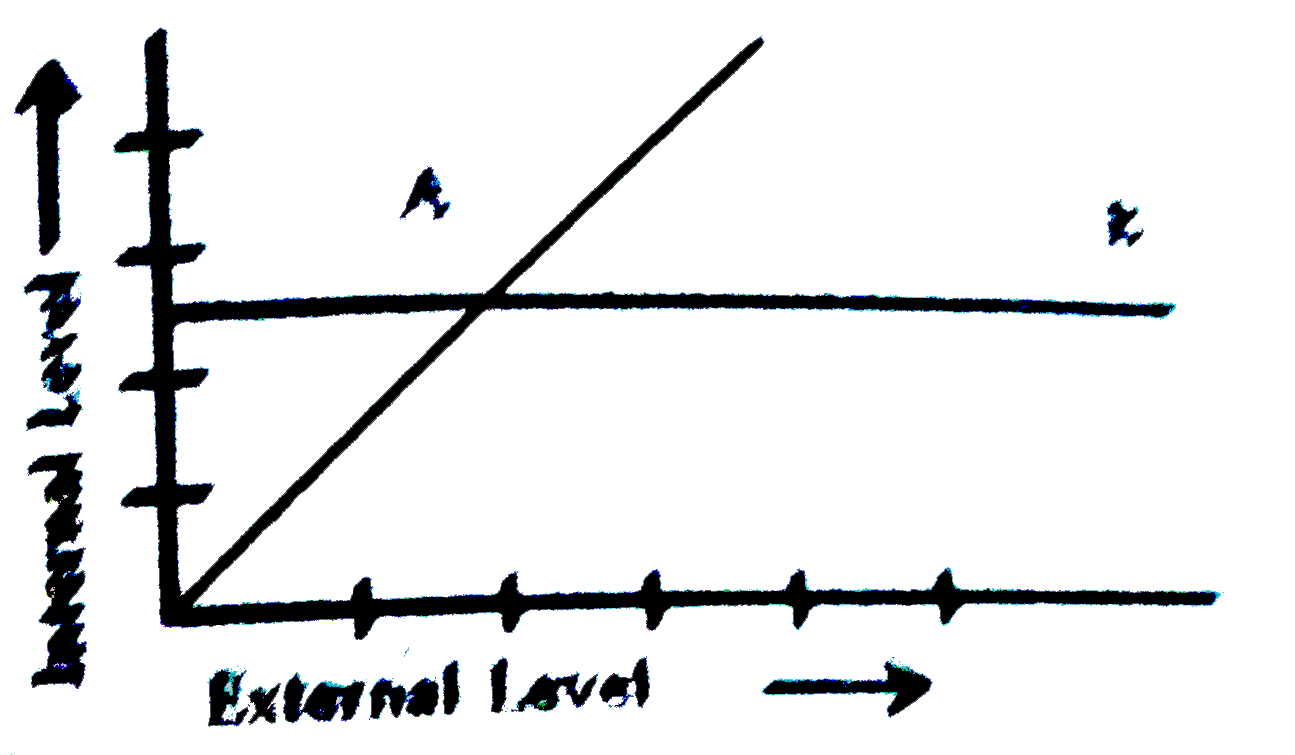
(a) The graph given below represents the organisms response to temperature as an environmental condition.
(i) Which one of the two lines represents conformers and why ?
(ii) What does the other line in the graph represent and why ?
(b) Mention the different adaptations the parasites have evolved with, to be able to successfully complete their life cycles in their hosts.
 View Solution
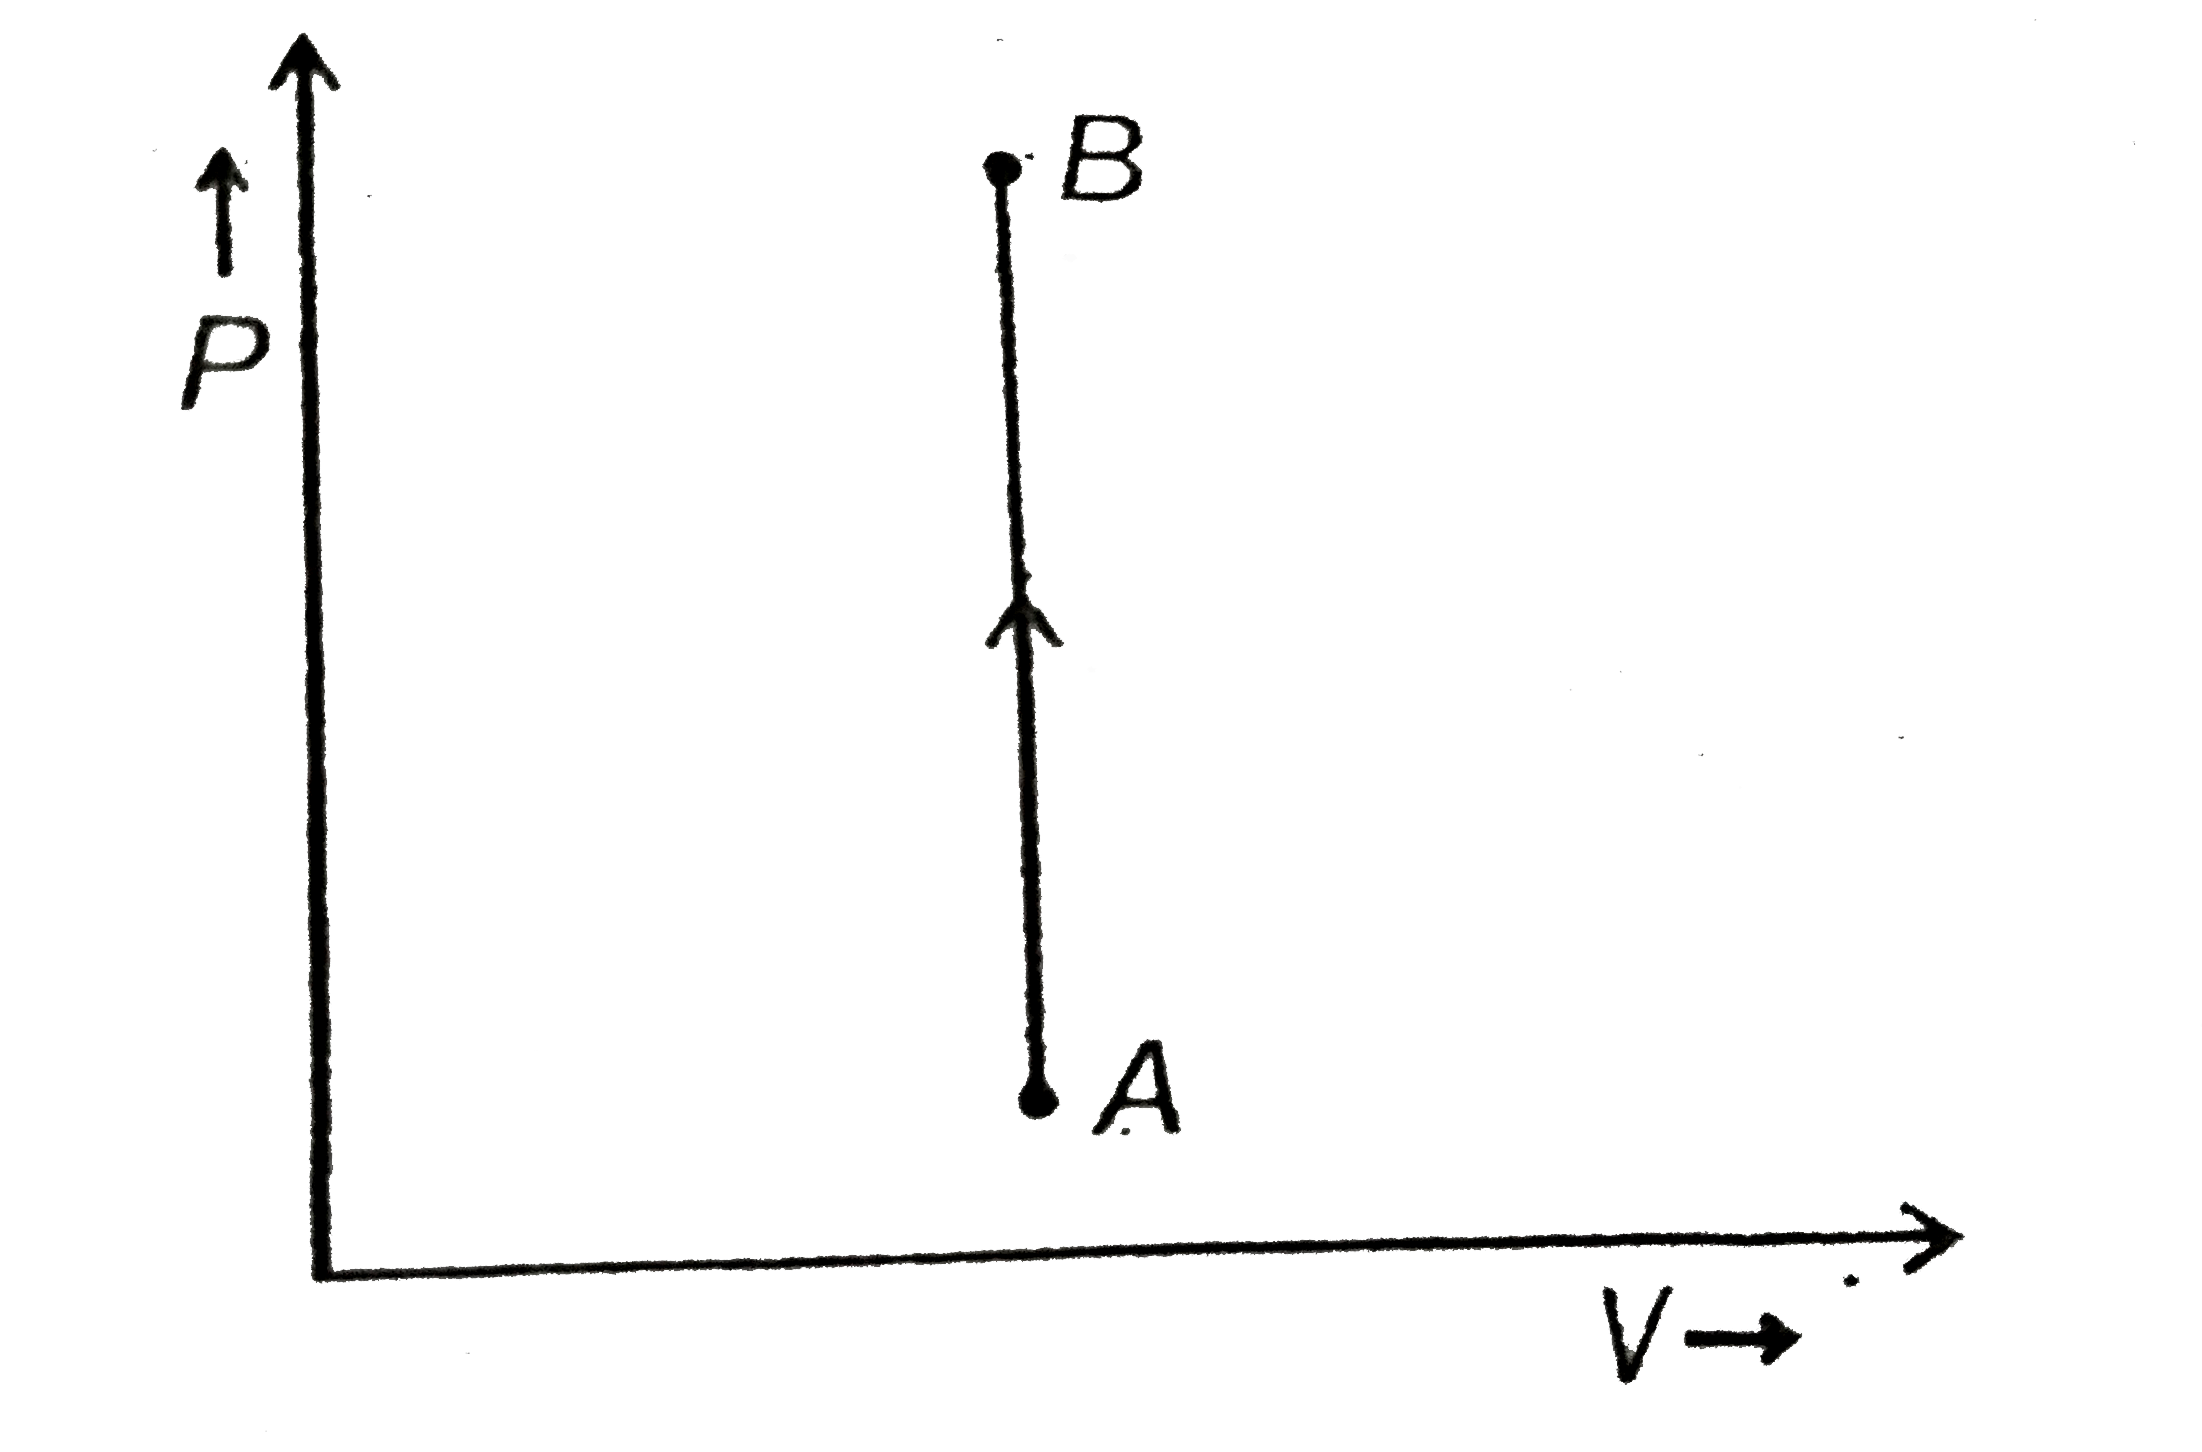
The following graph represents
 View Solution
Knowledge Check
- Question 1 - Select One
Refer to the given graph representing interplay of different hormones (A-D) during menstrual cycle in women and answer the question that follow.
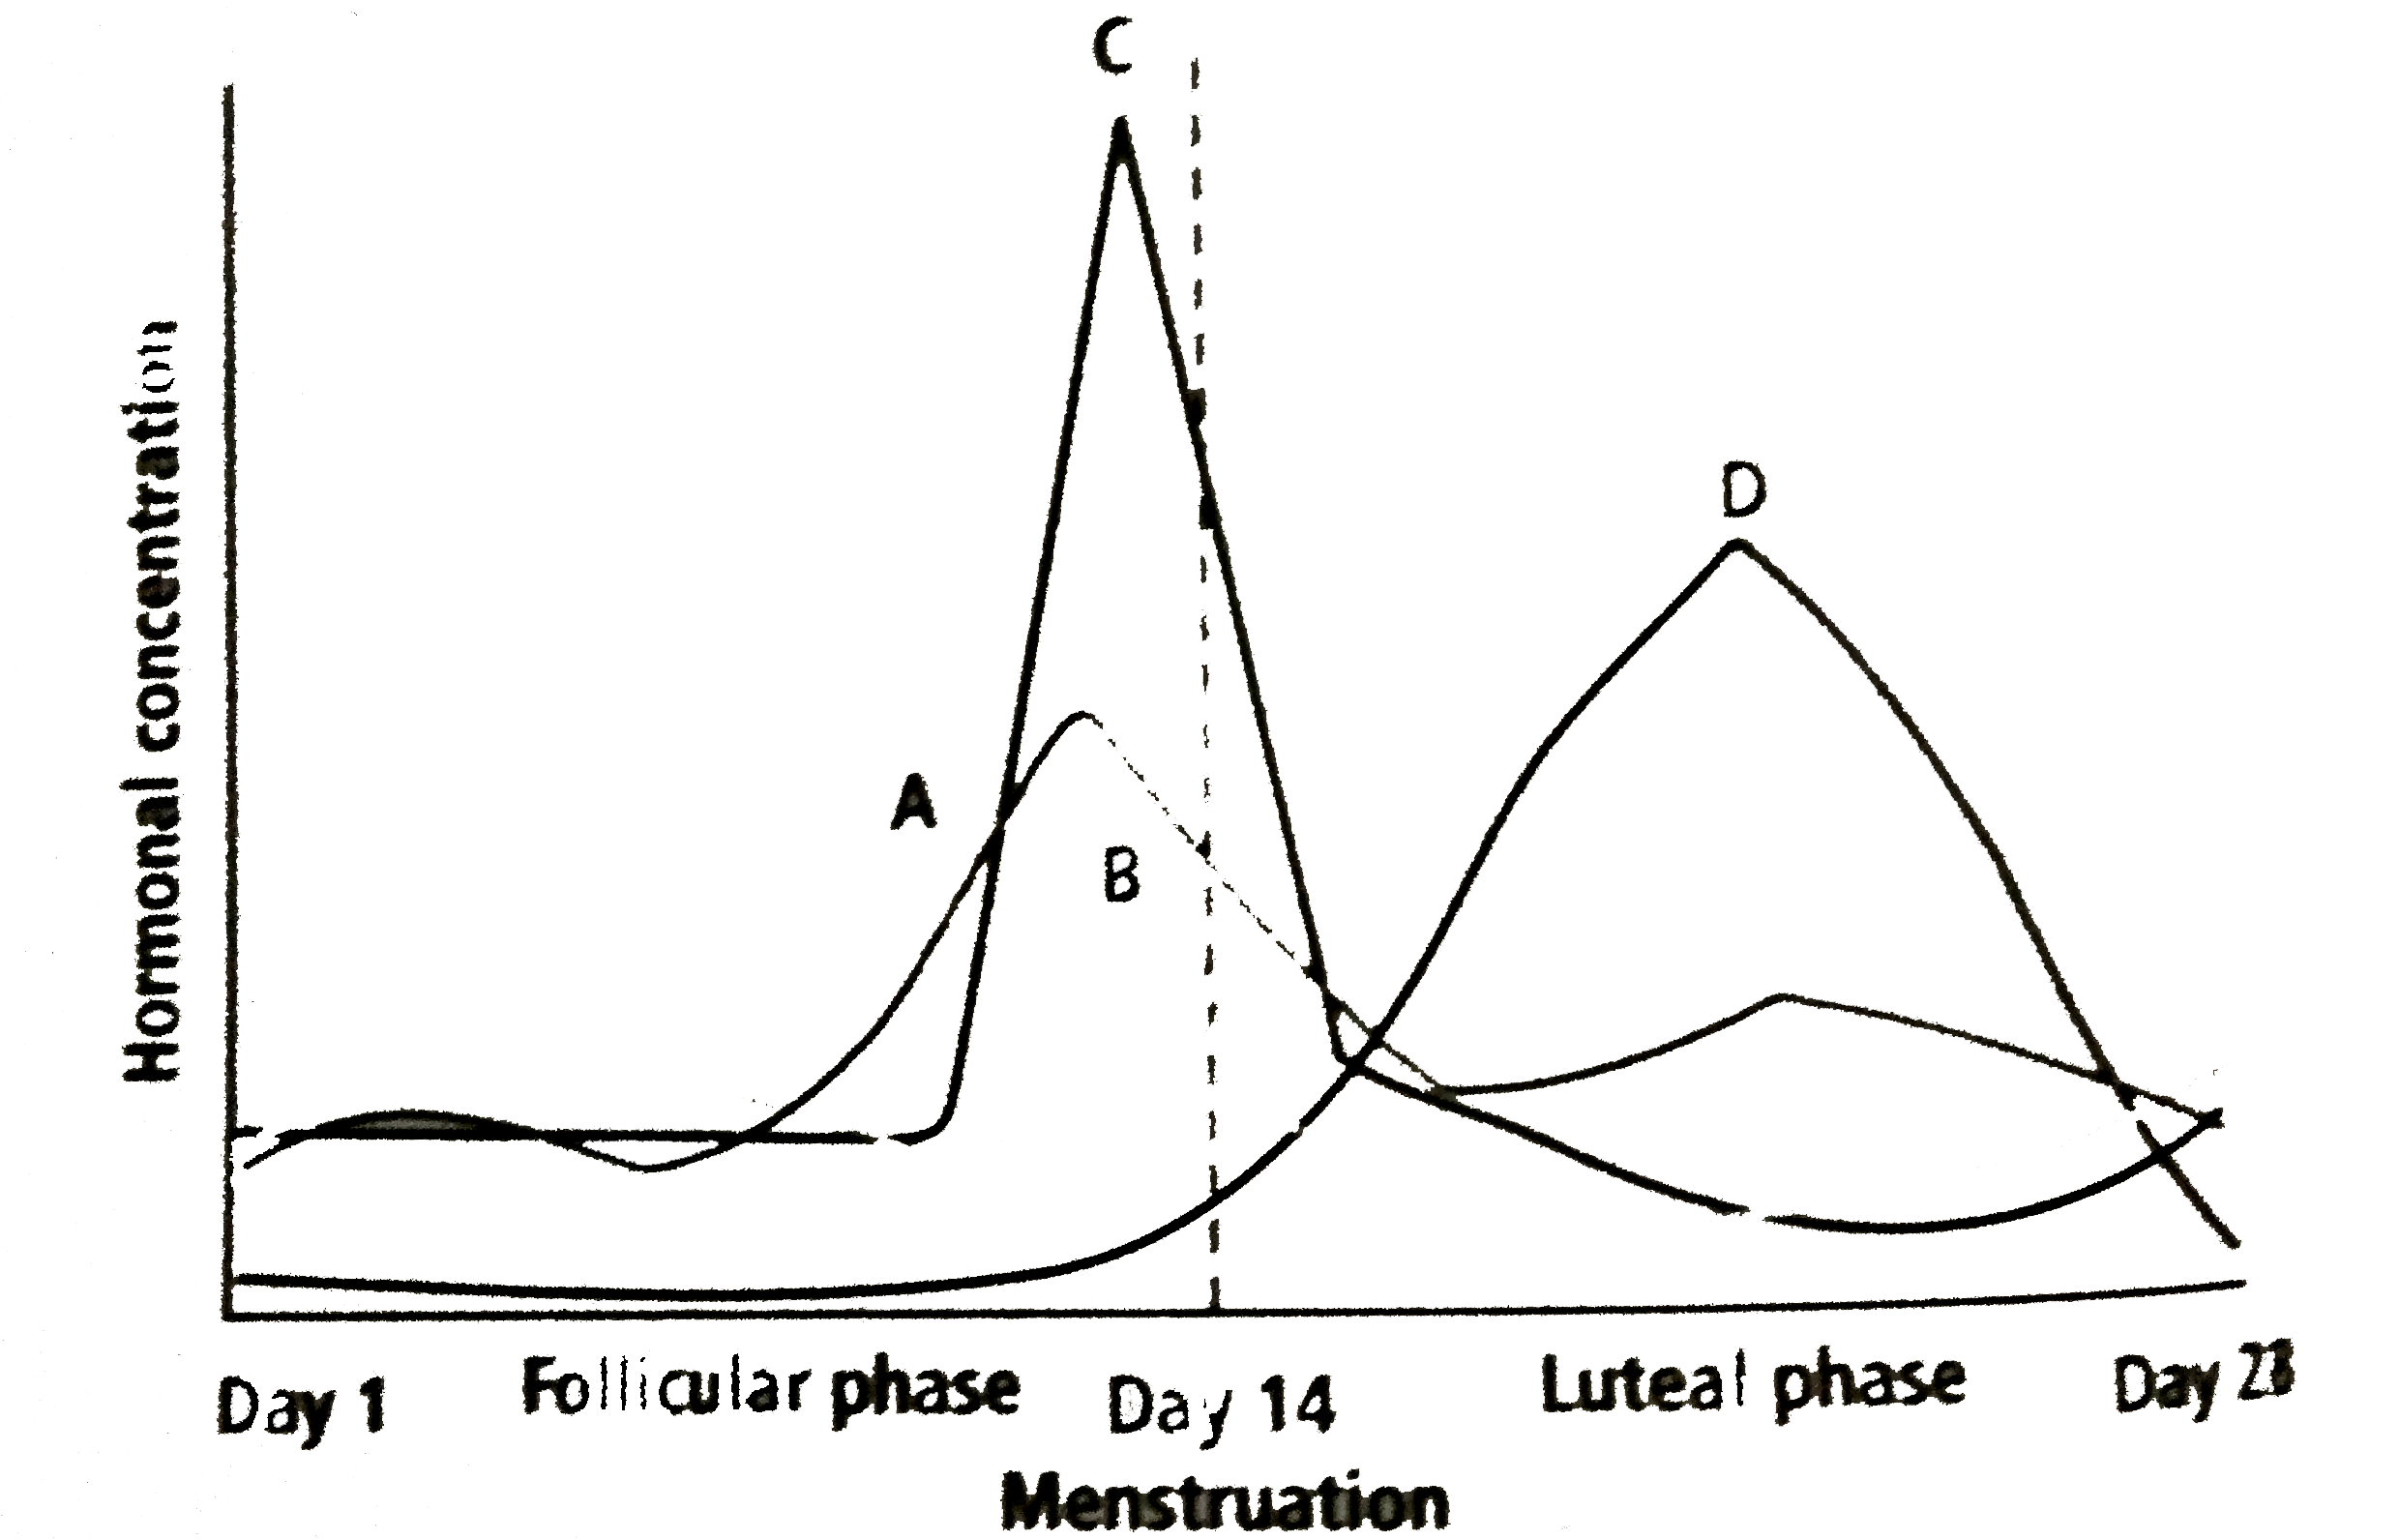
Which hormones is most effective in producing uterine changes during menstrual cycle?AABBCCDD - Question 2 - Select One
Refer to the given graph representing interplay of different hormones (A-D) during menstrual cycle in women and answer the question that follow.
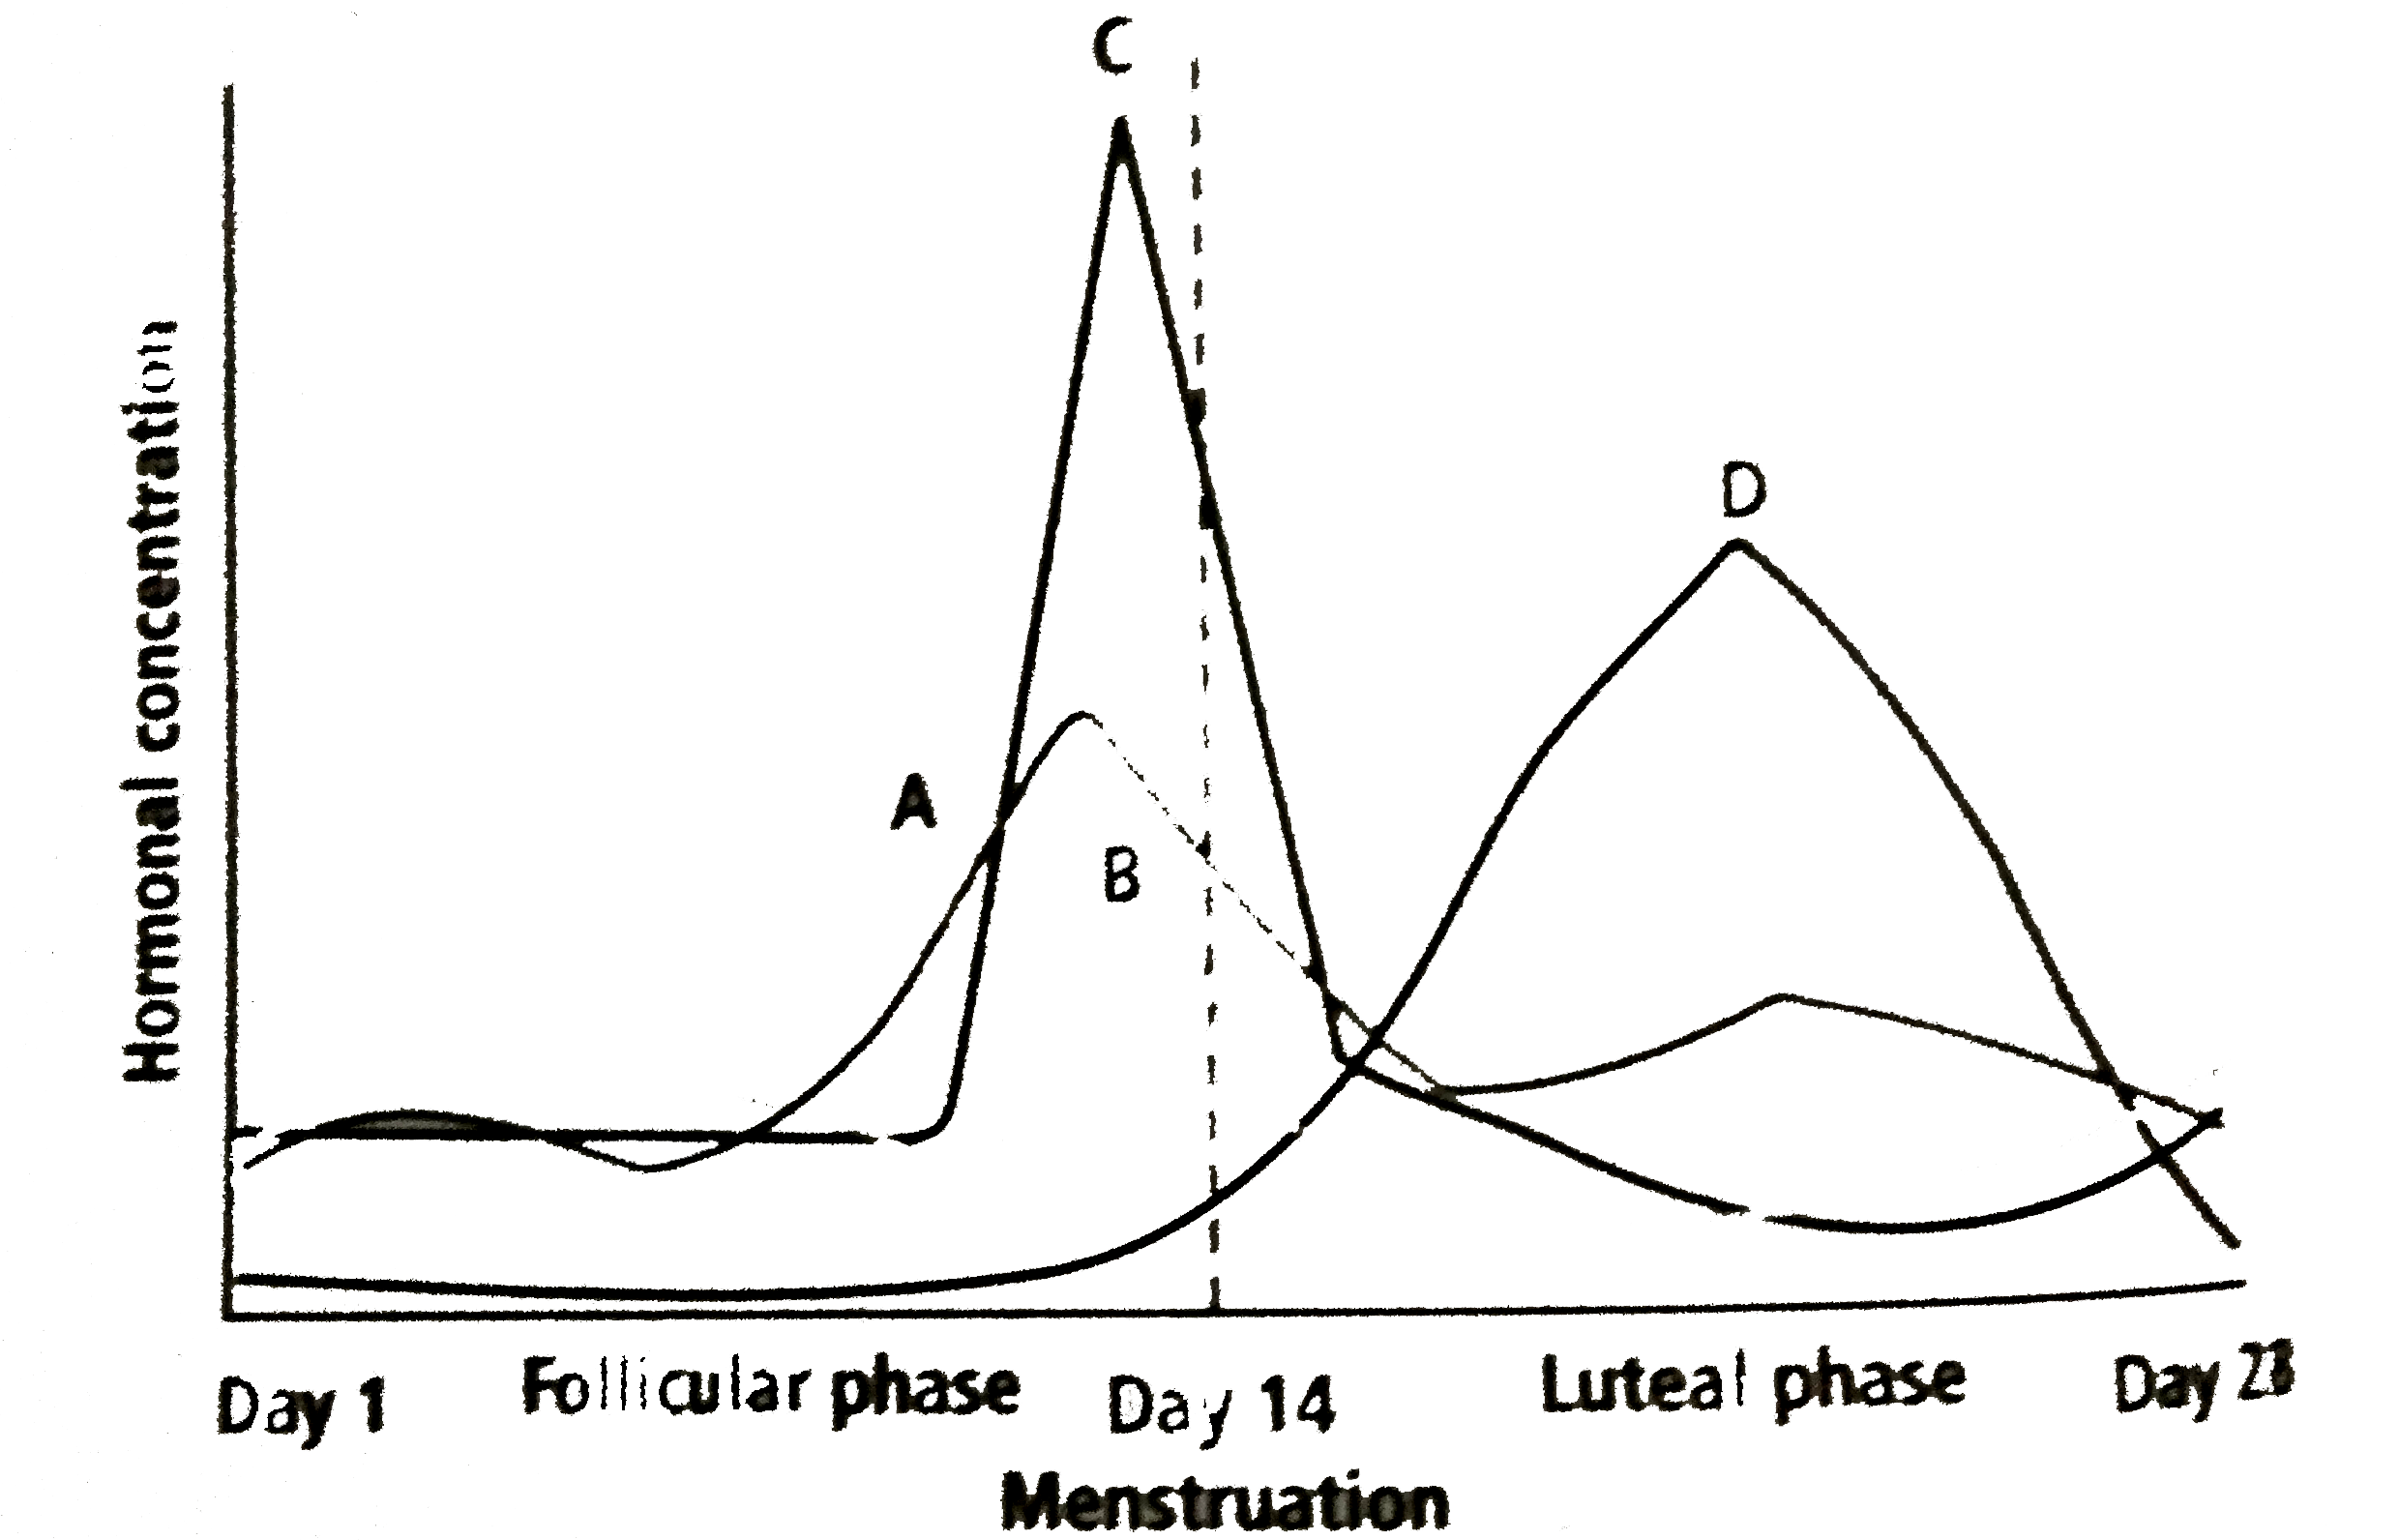 Which hormone (A,B,C or D) is necessary for the final follicular grwoth and ovulation? AABBCCDD
 - Question 3 - Select One
Refer to the given graph representing interplay of different hormones (A-D) during menstrual cycle in women and answer the question that follow.
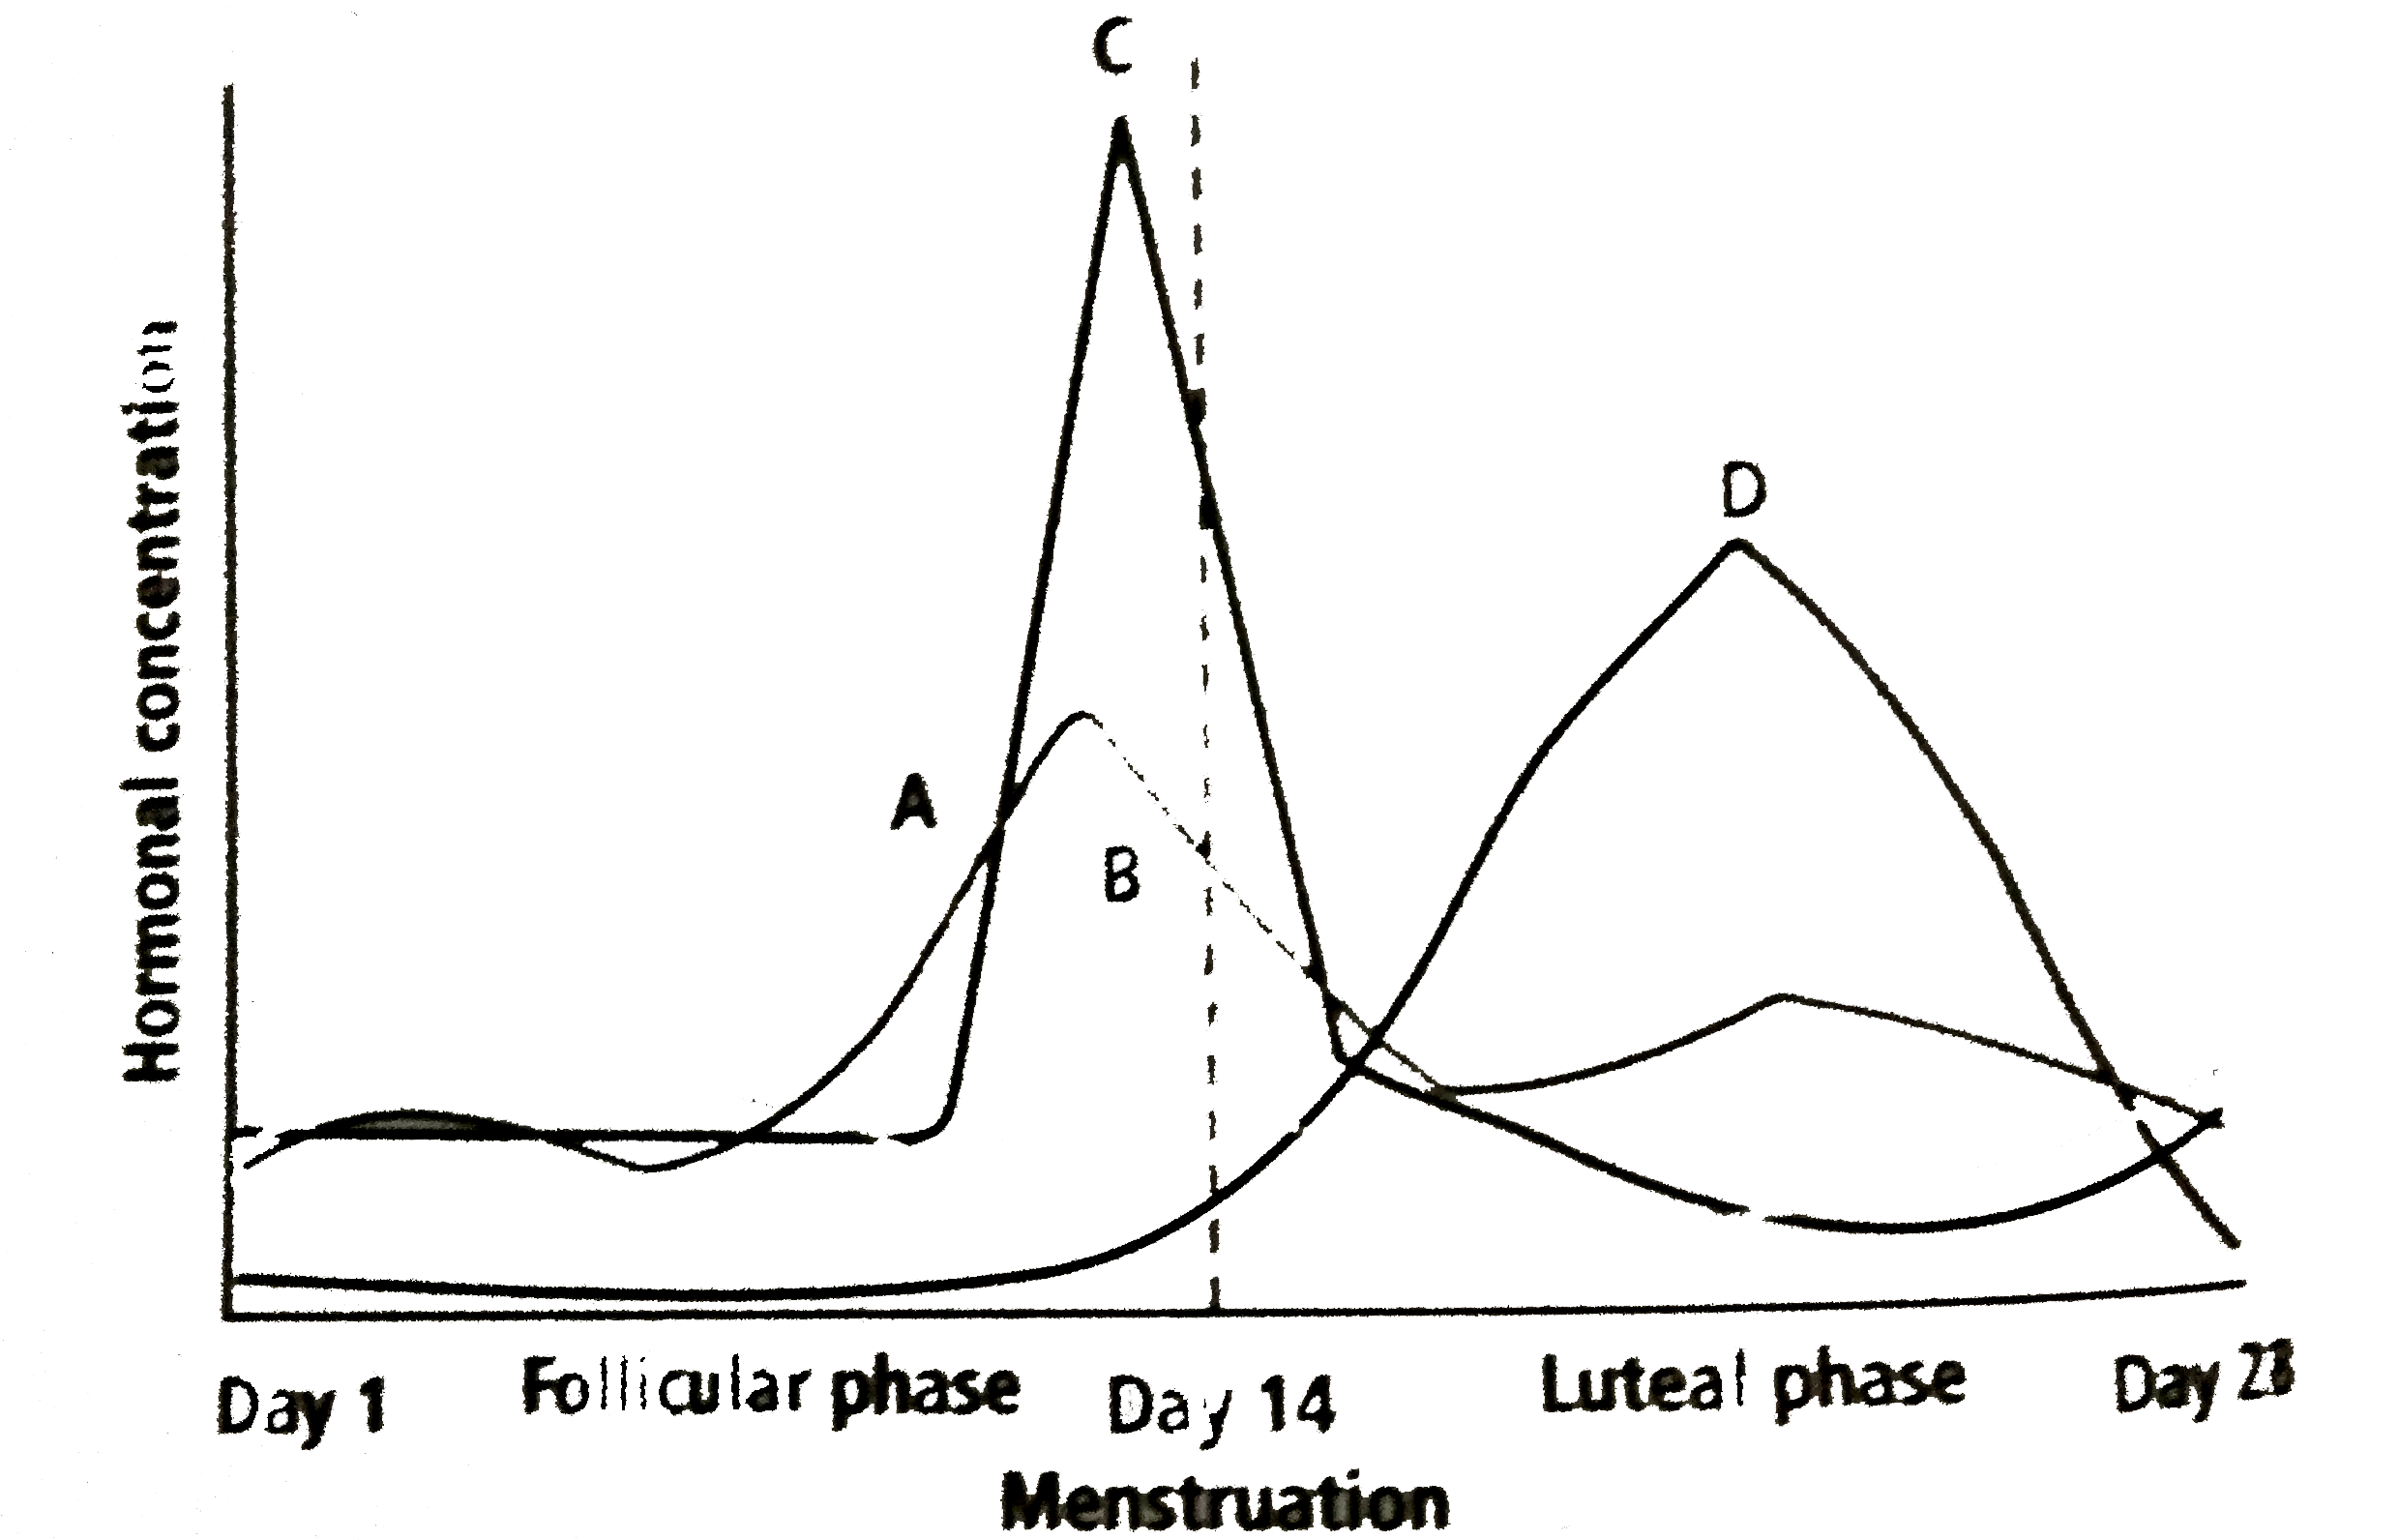
Cessation of secretion of which of these hormones may lead to osteoporosis?AABBCCDD
Refer to the given graph representing interplay of different hormones (A-D) during menstrual cycle in women and answer the question that follow.
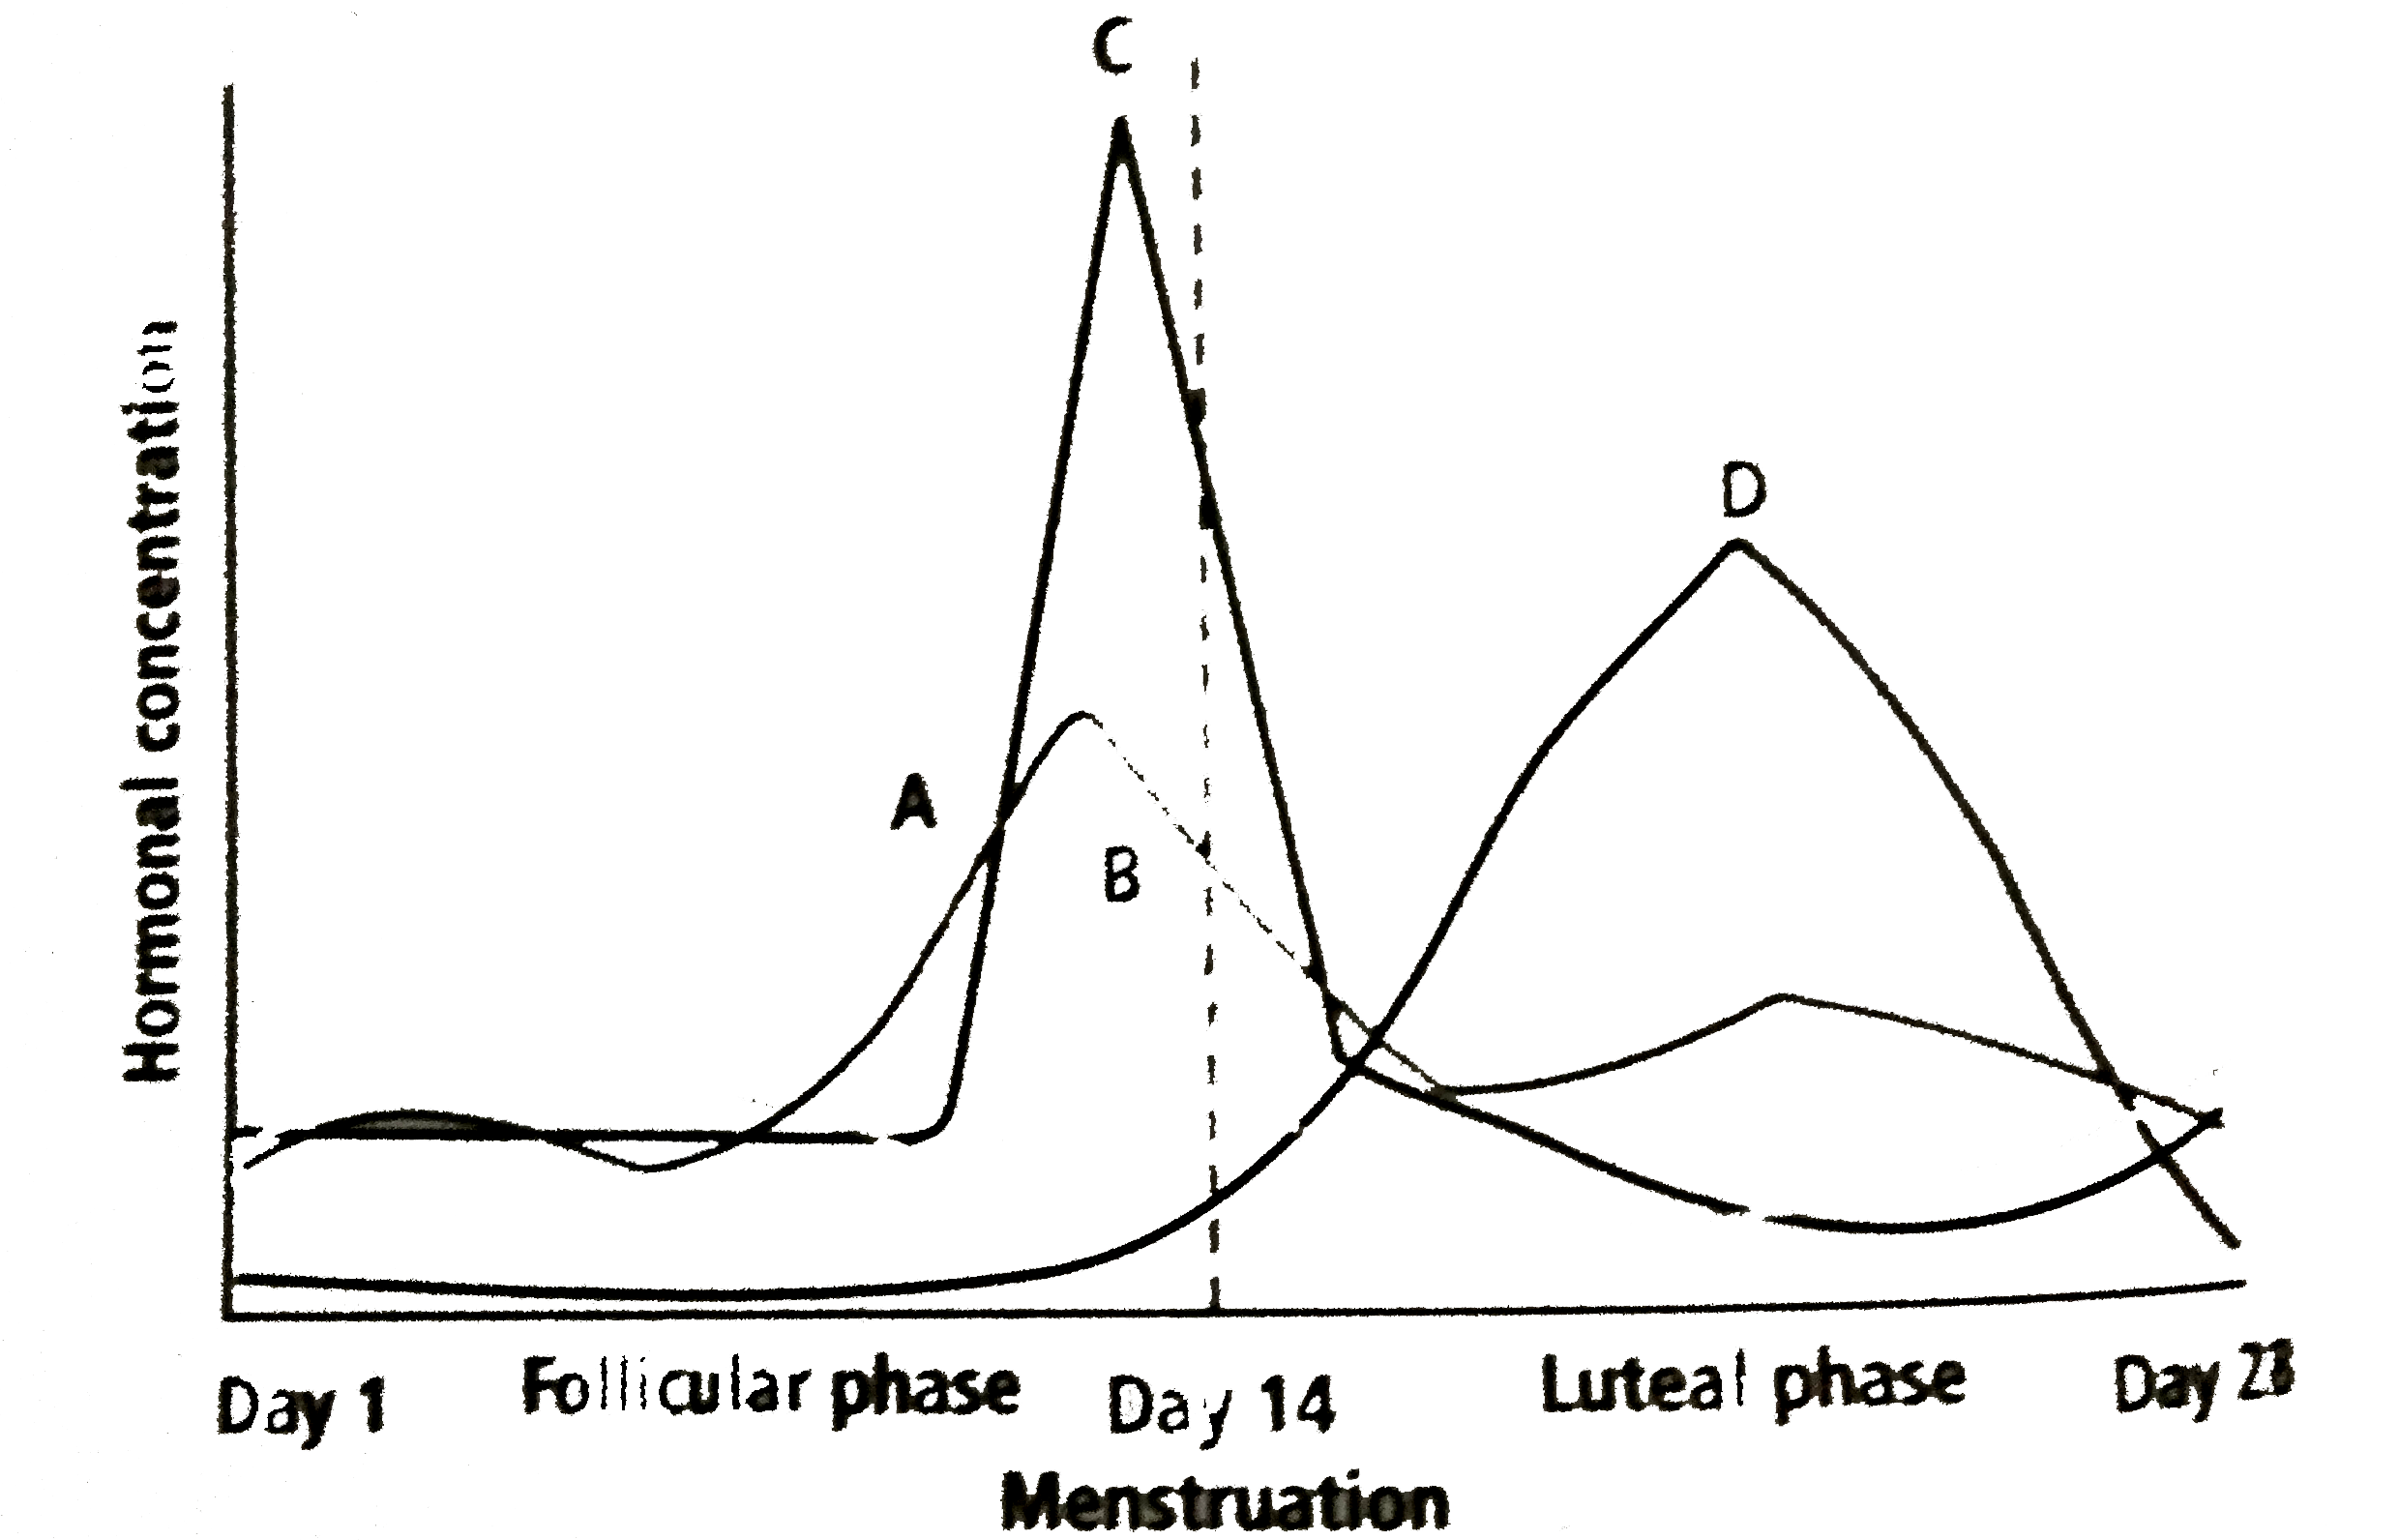
Which hormones are excreted in urine after menopause?View SolutionGiven graph represents the response of organisms to various abiotic factors. On this basis, select the correct option for (i), (ii) and(iii)
 View Solution
Given graph represents the absorption specra of three photosynthetic pigments chl a, chl b and β-carotene.
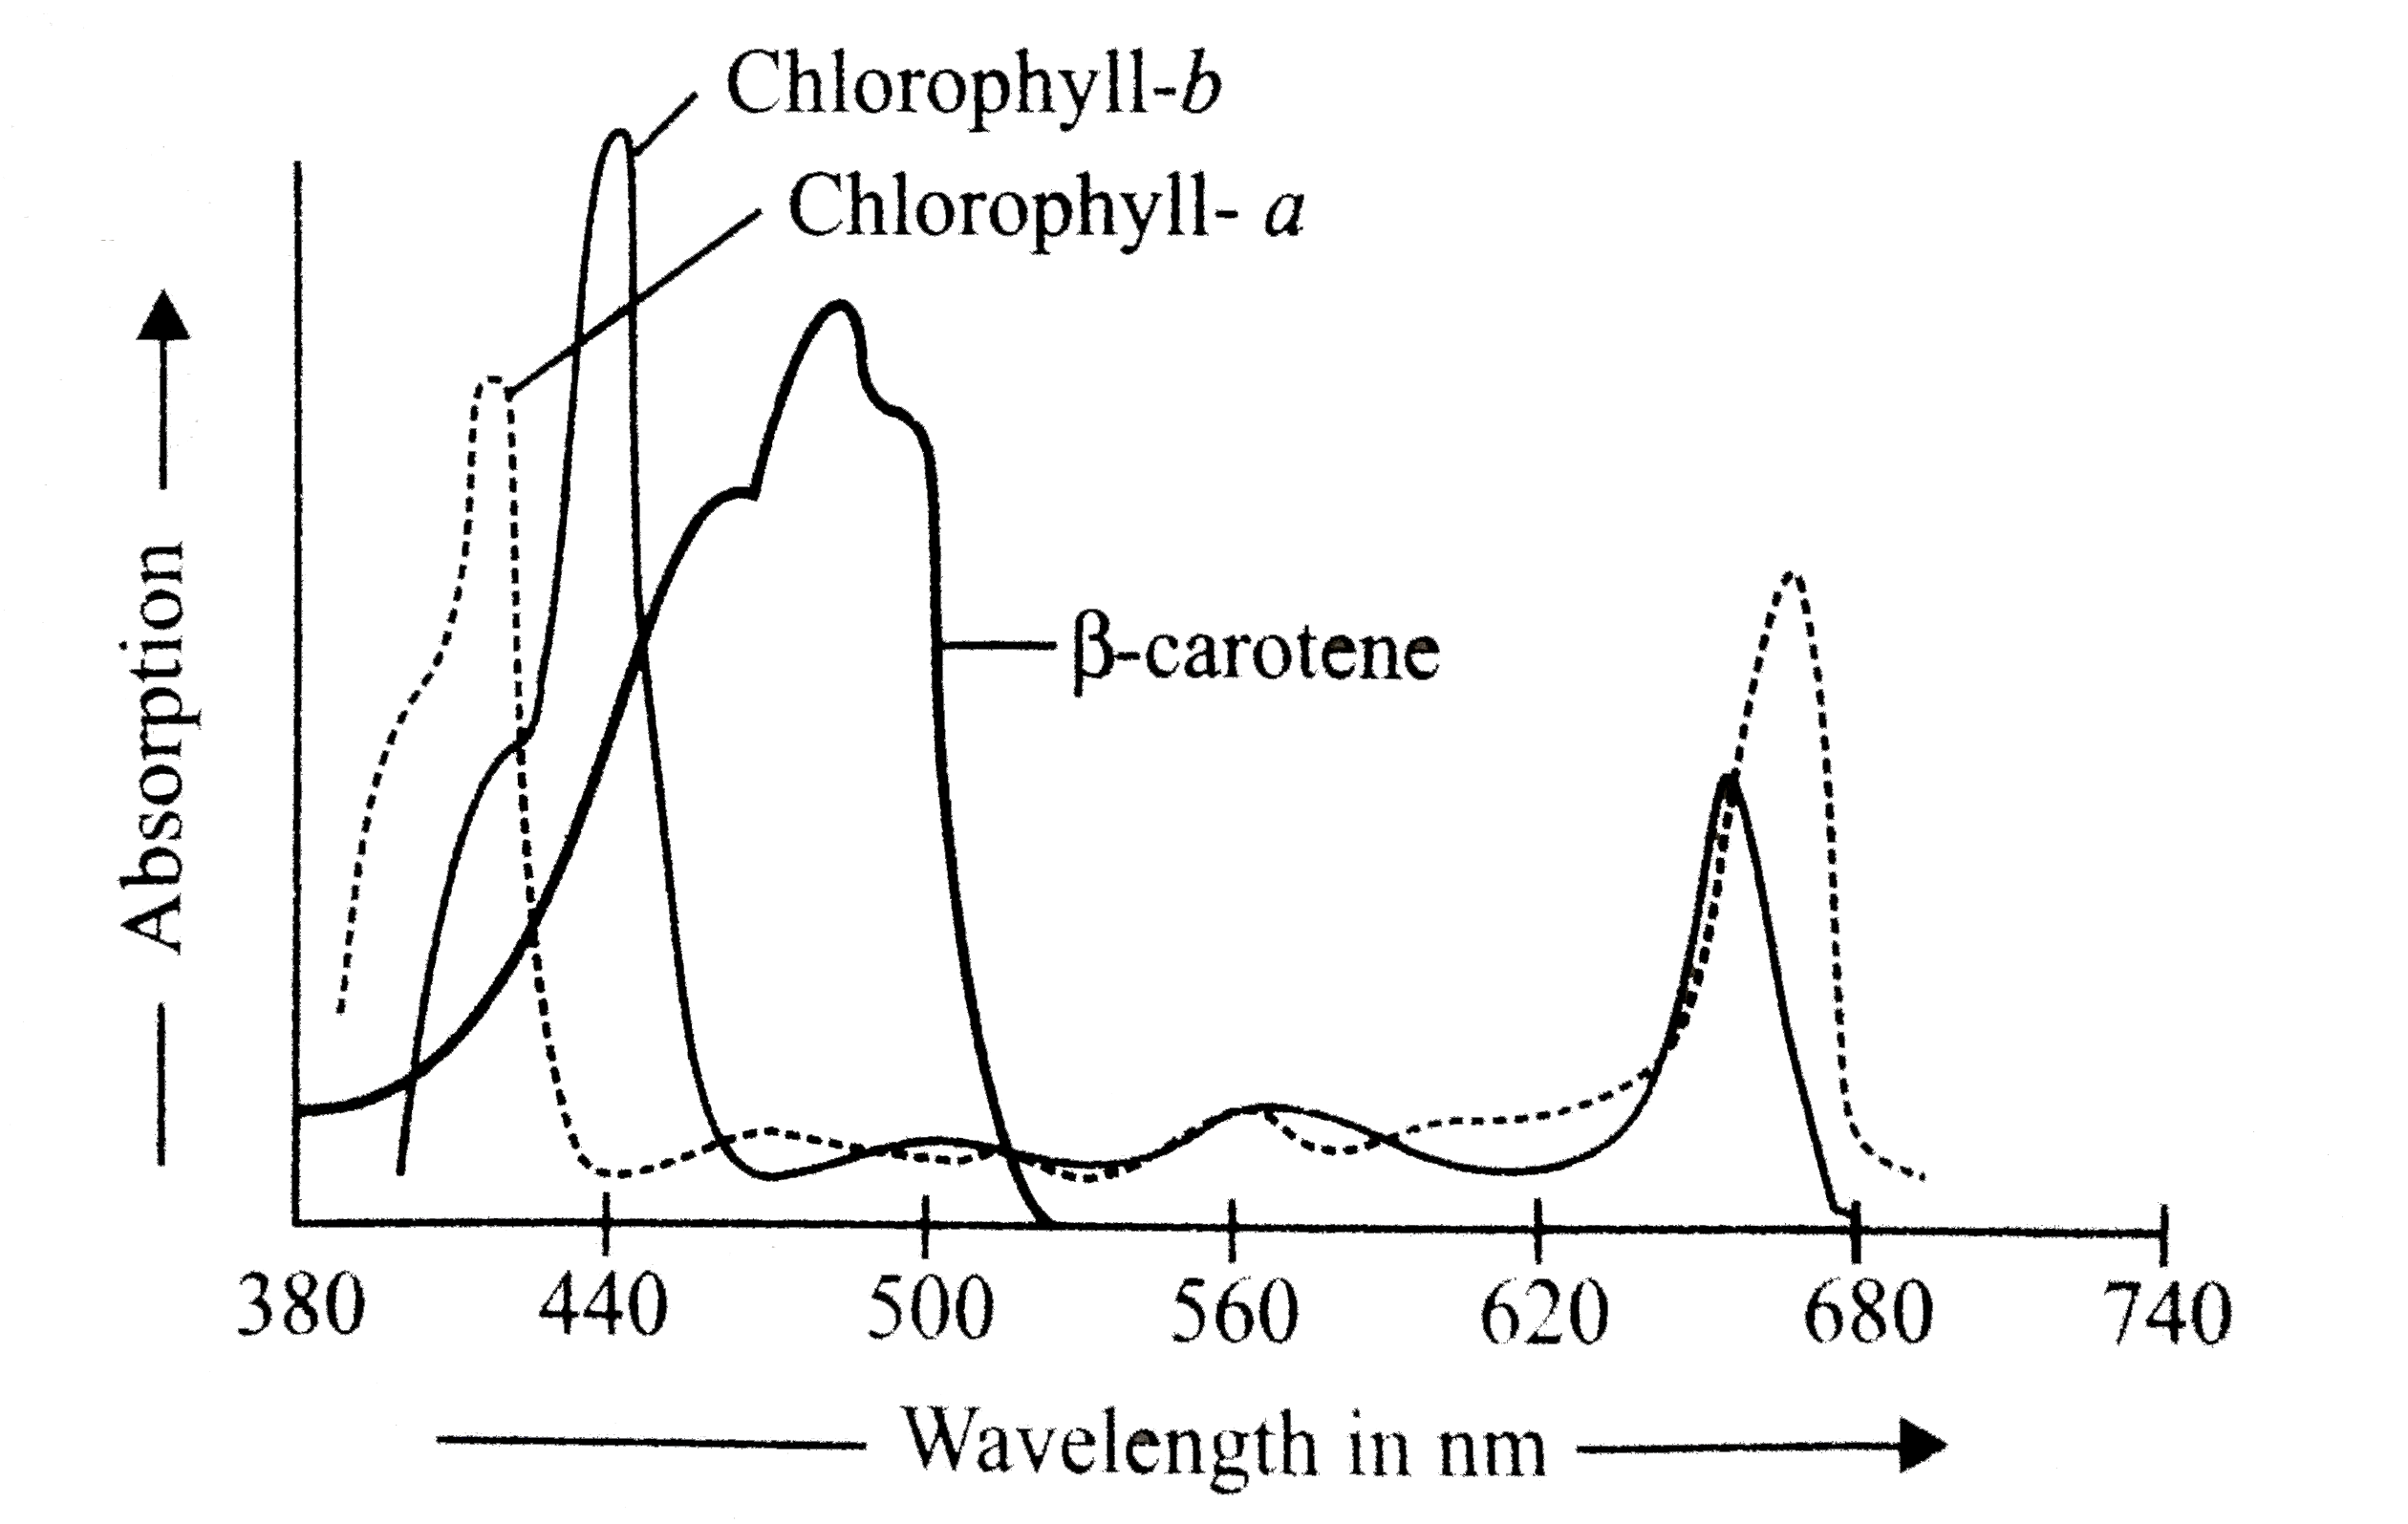
Select the correct statement regarding this.View Solution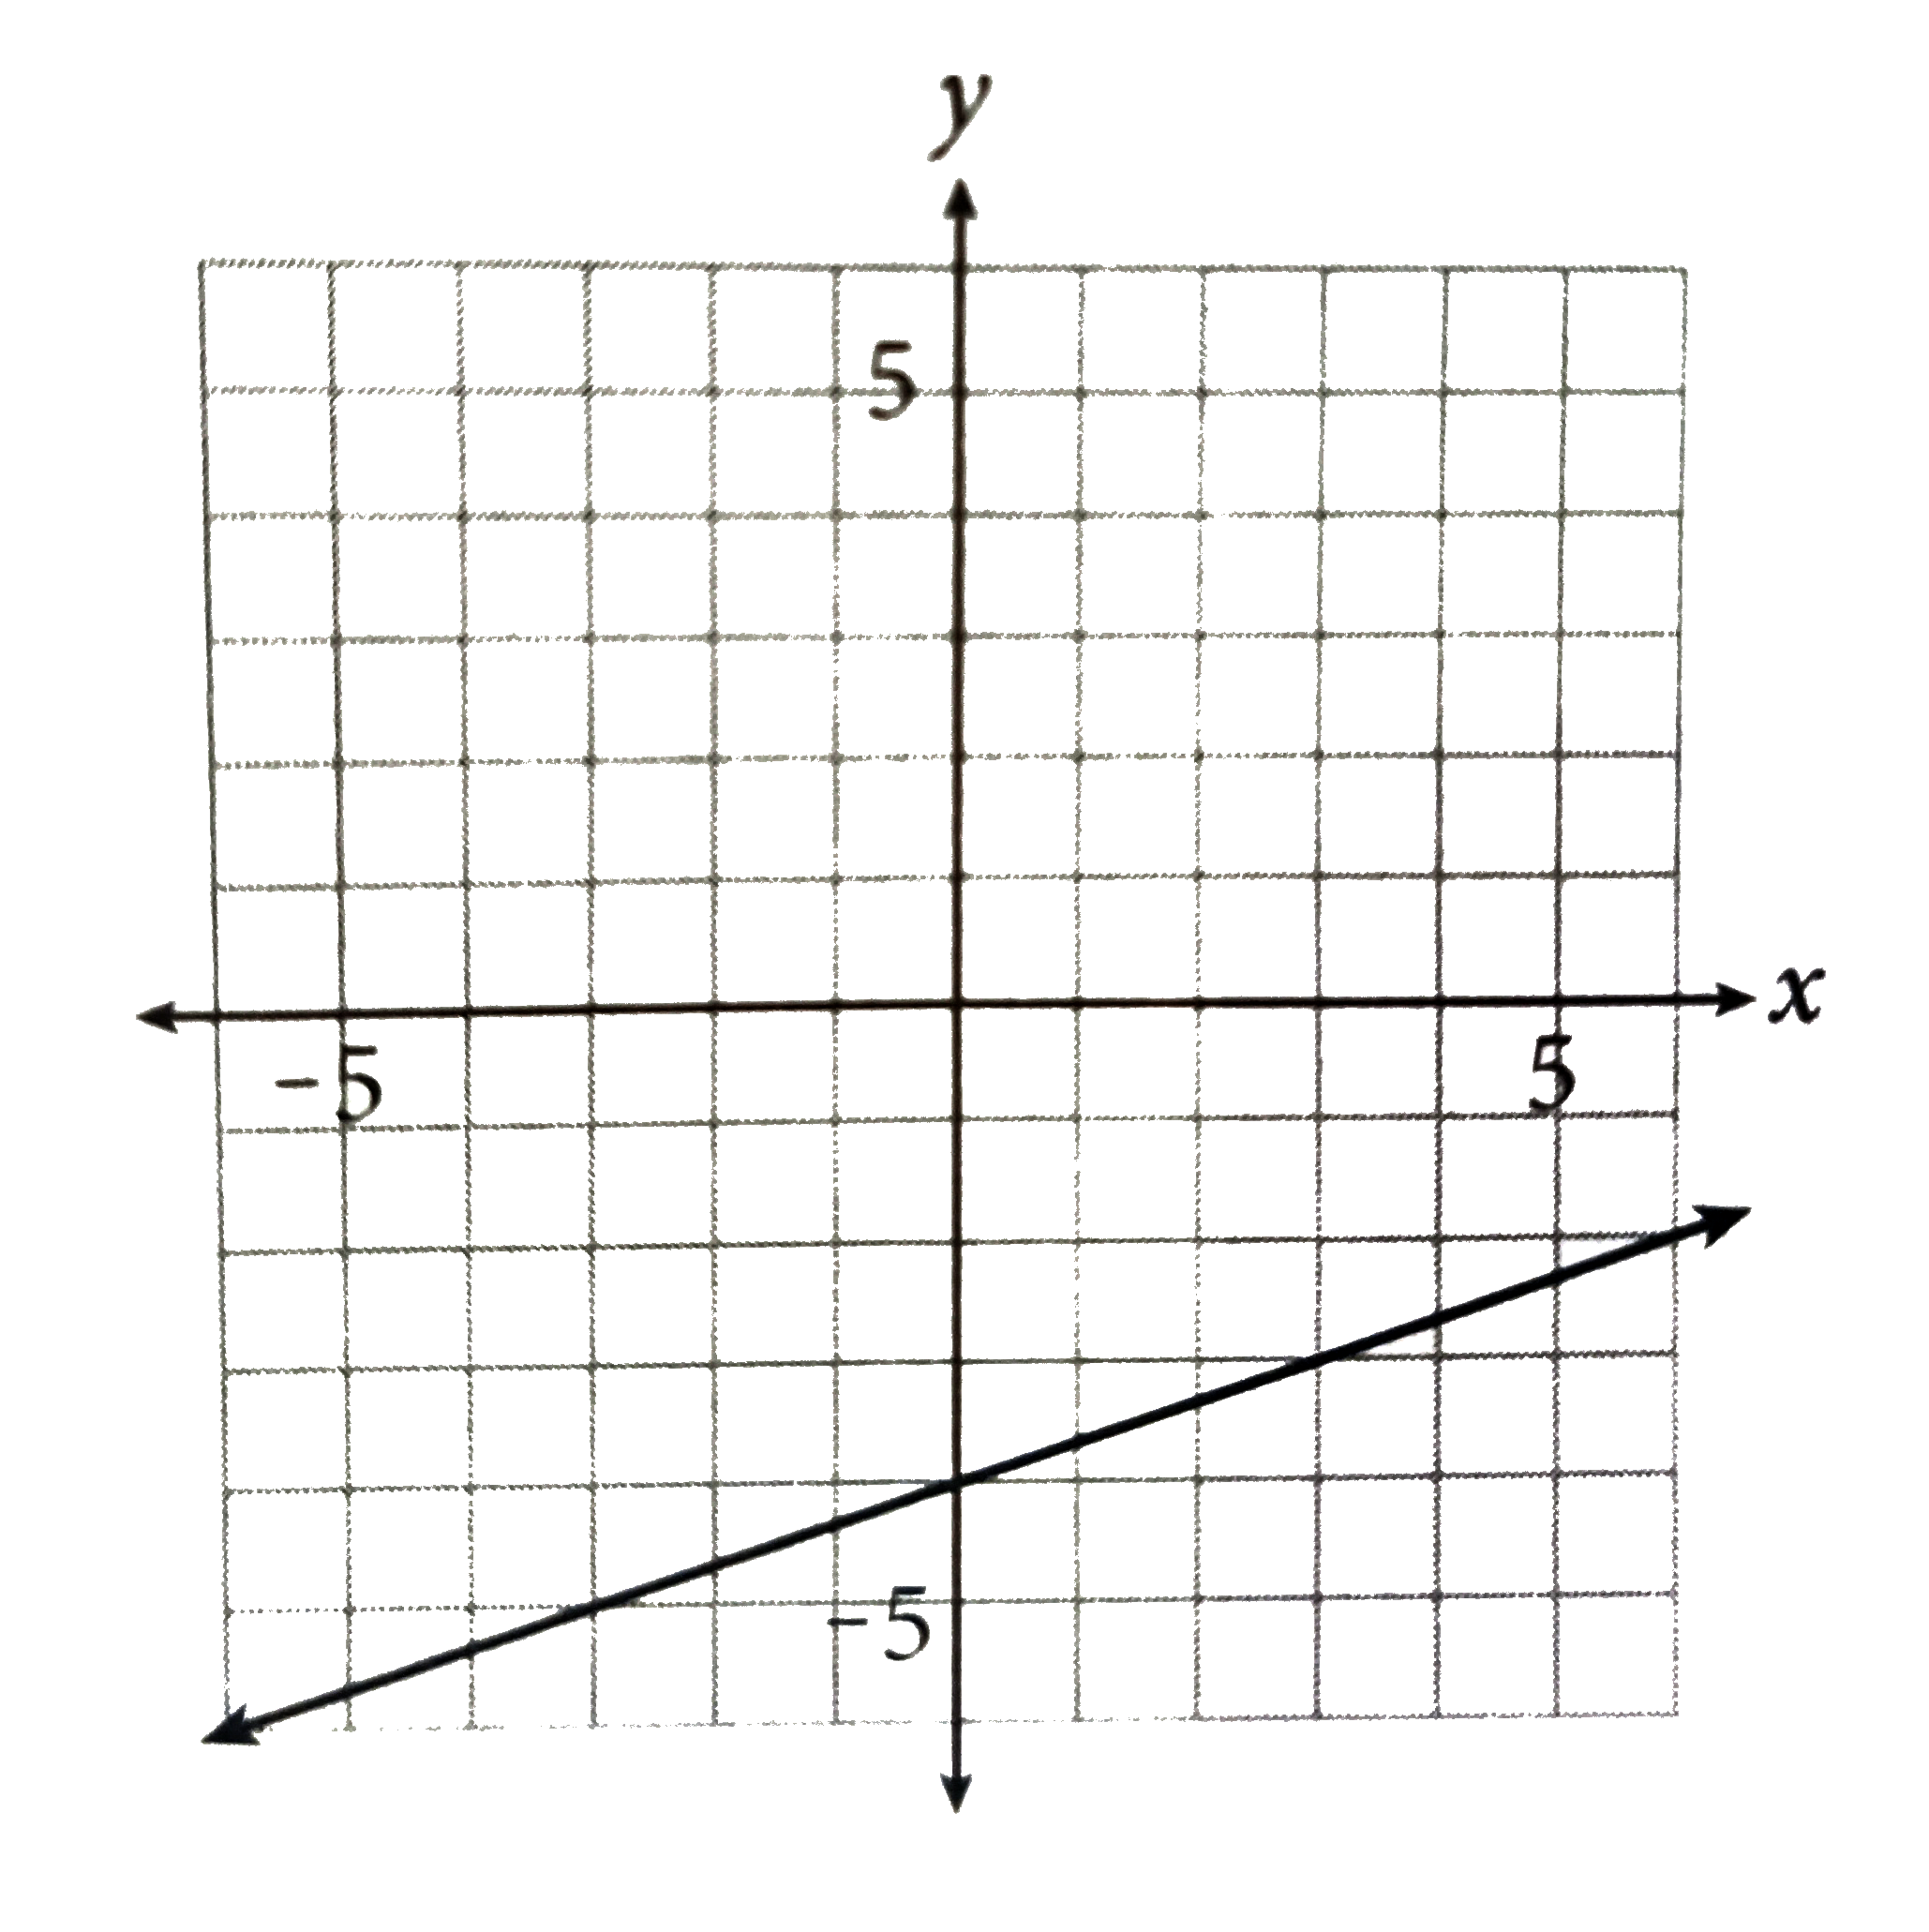
The graph shown represents which of the following equations ?View SolutionWhich of the following graph represents correct graph for SN1 reaction :
View Solution

