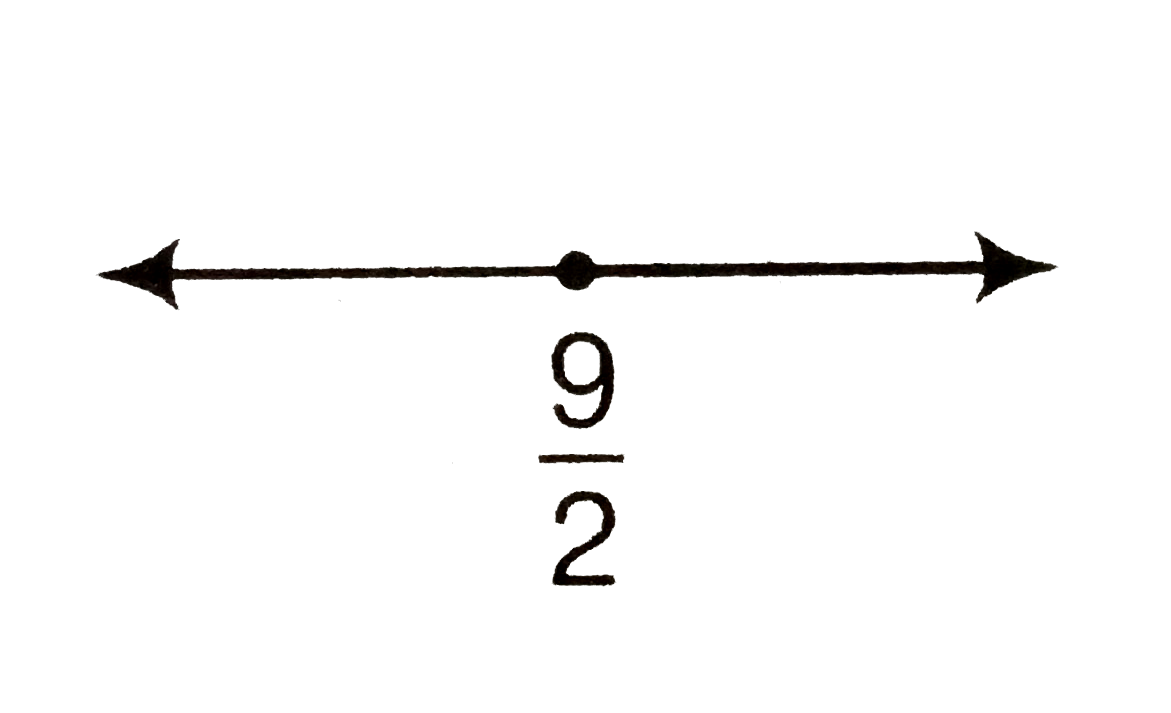
The inequality representing the following graph is
A
x∈(92,∞)
B
x∈[92,∞)
C
x∈−[∞,92)
D
x∈(−∞,92]
Video Solution
Text Solution
The correct Answer is:B
The given graph represents all the values greater than 92 including92 as the real line.
x∈[92,∞)
|
Updated on:21/07/2023
Topper's Solved these Questions
- BOOK - NCERT EXEMPLAR ENGLISHCHAPTER - LINEAR INEQUALITIESEXERCISE - Long Answer Type Question6videos
LINEAR INEQUALITIES
- BOOK - NCERT EXEMPLAR ENGLISHCHAPTER - LIMITS AND DERIVATIVES EXERCISE - FILLERS4videos
LIMITS AND DERIVATIVES
- BOOK - NCERT EXEMPLAR ENGLISHCHAPTER - MATHEMATICAL REASONING EXERCISE - OBJECTIVE TYPE QUESTIONS21videos
MATHEMATICAL REASONING
Similar Questions
Knowledge Check
- Question 1 - Select One
Which of the following inequalities represents the graph shown below on the real number line ?
 A0<x<5B0<x≤4C−2<x≤4D1≤x≤4
 - Question 2 - Select One
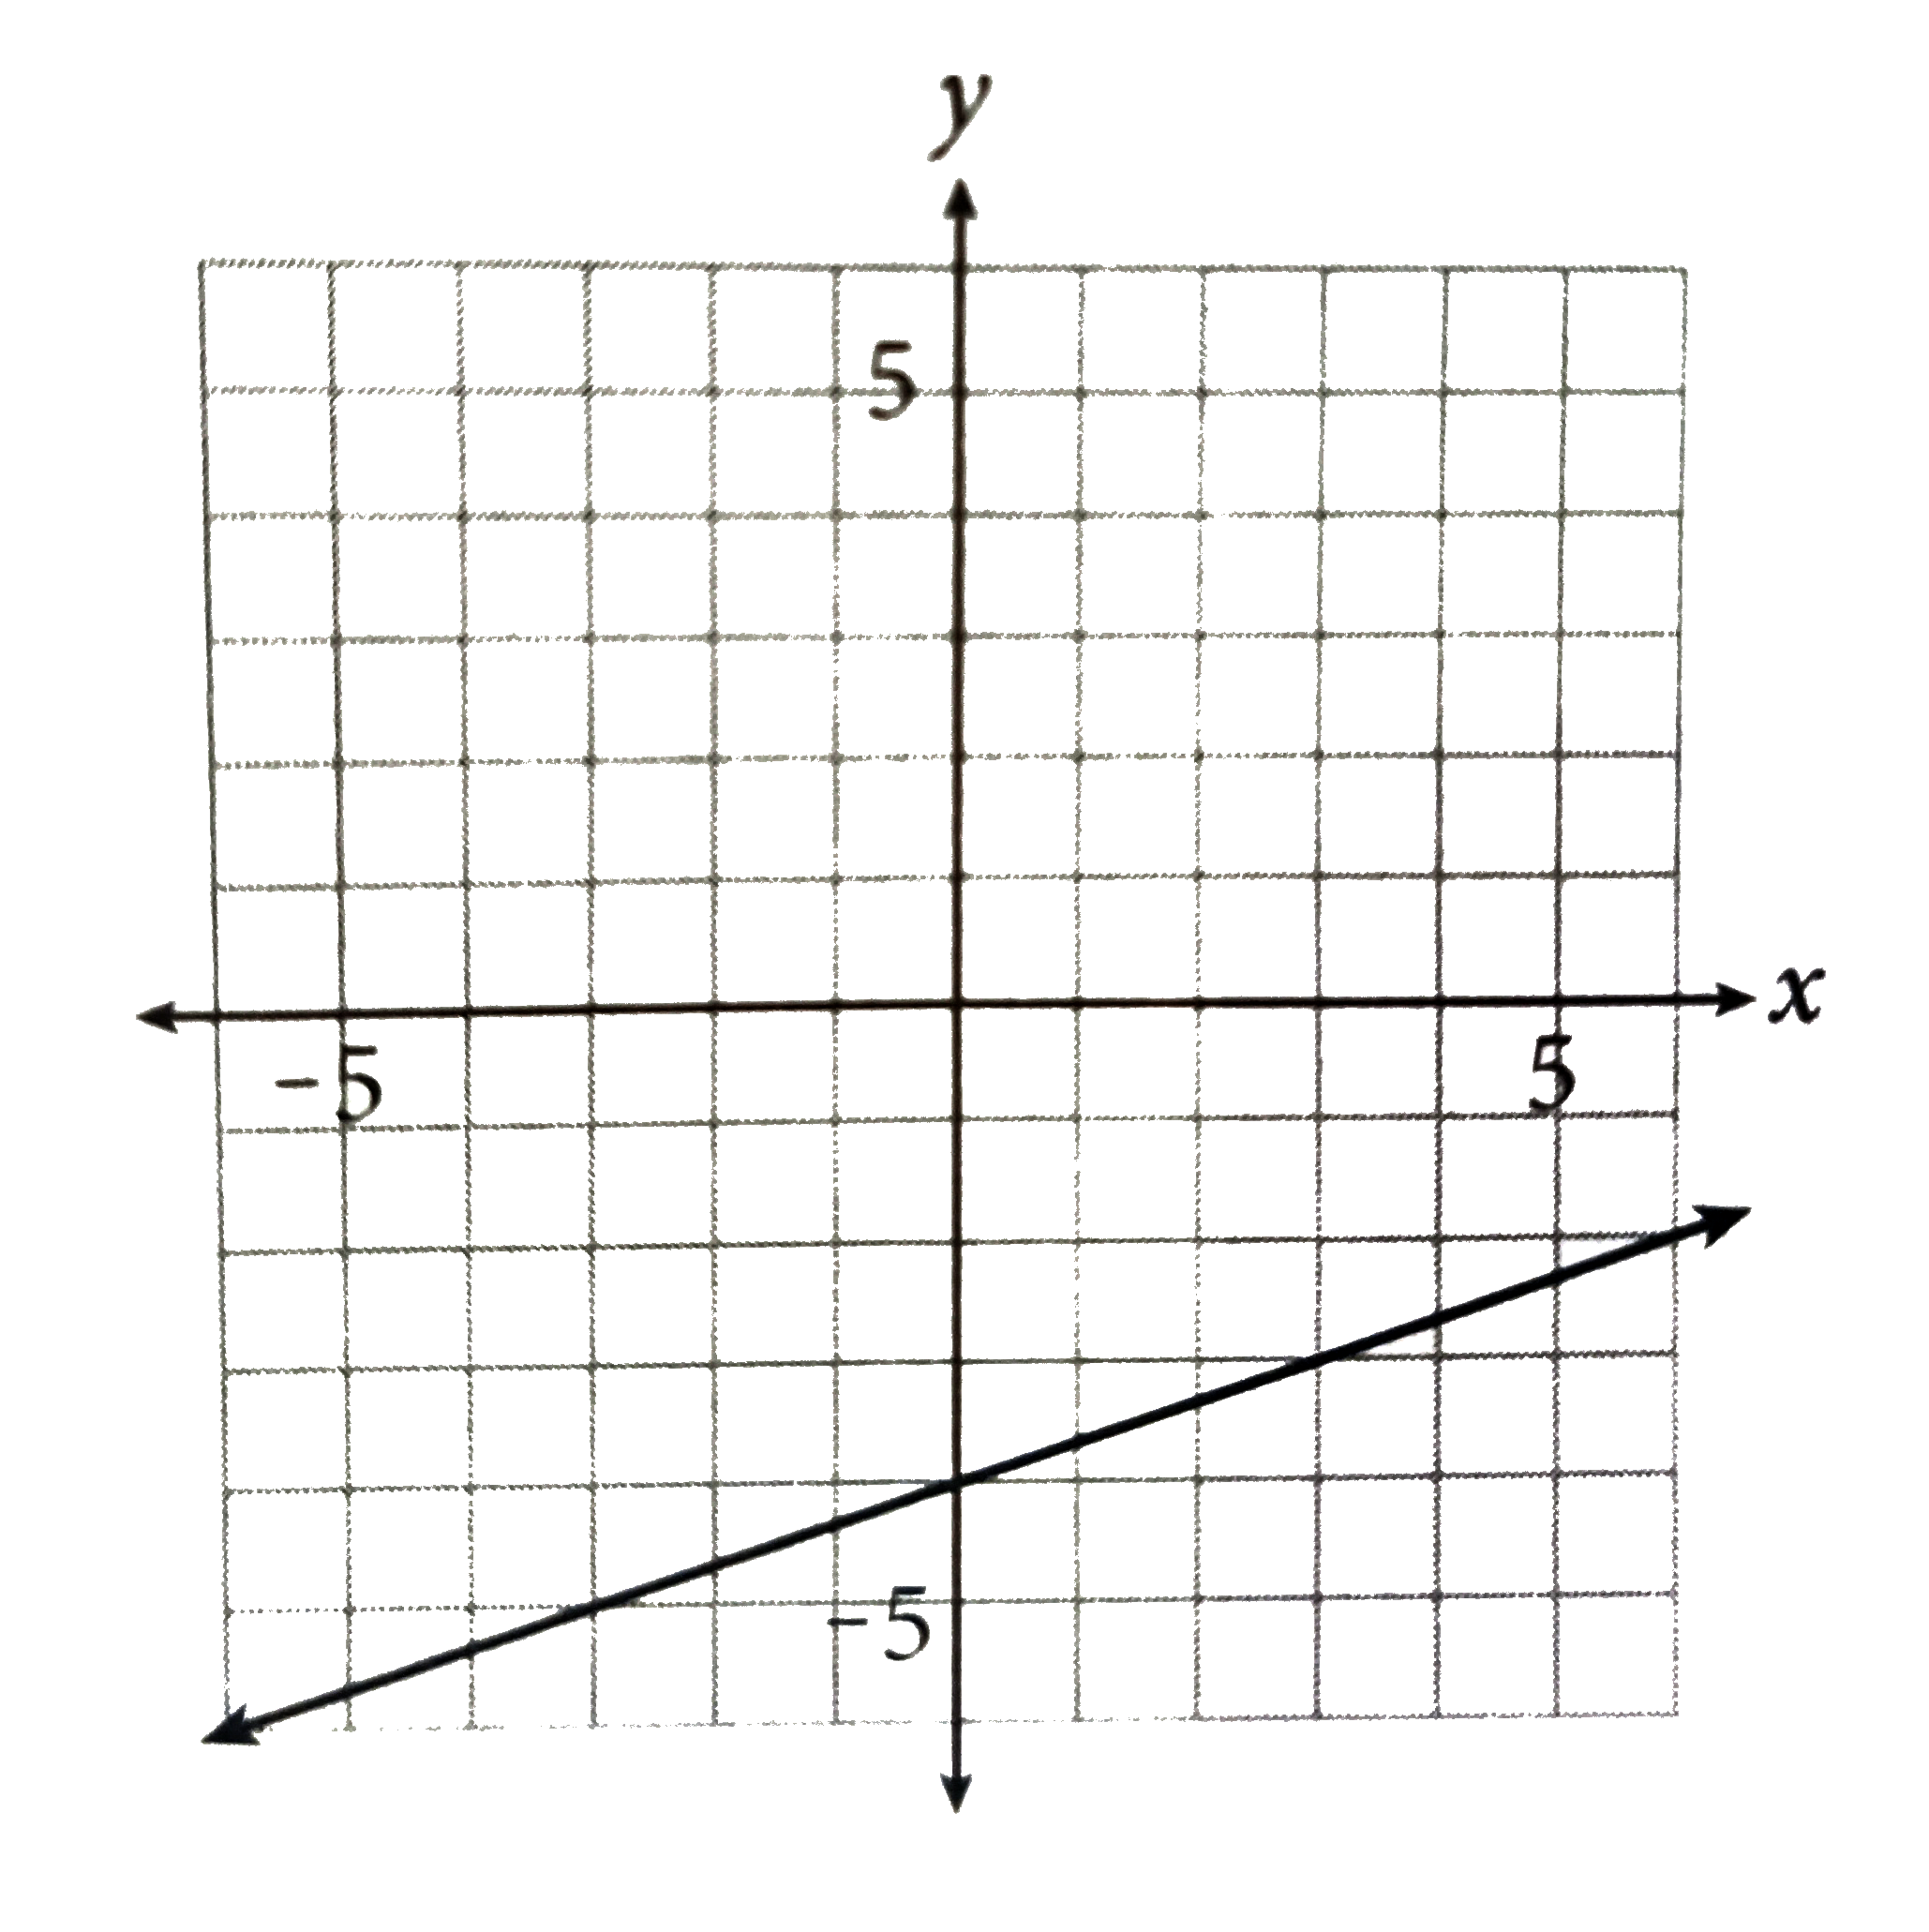
The graph shown represents which of the following equations ?Ay=−3x+4By=−13x+4Cy=13x−4Dy=3x−4 - Question 3 - Select One
The solution of the linear inequality in x represented on number line as
 AA. (−∞,−53]BB. (−∞,−53)CC. (−53,∞)DD. [−53,∞)
State the law which are represented by the following graphs.
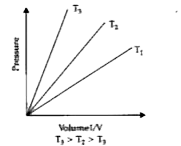 View Solution
State the laws which are represented by the following graphs.
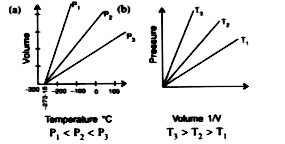 View Solution
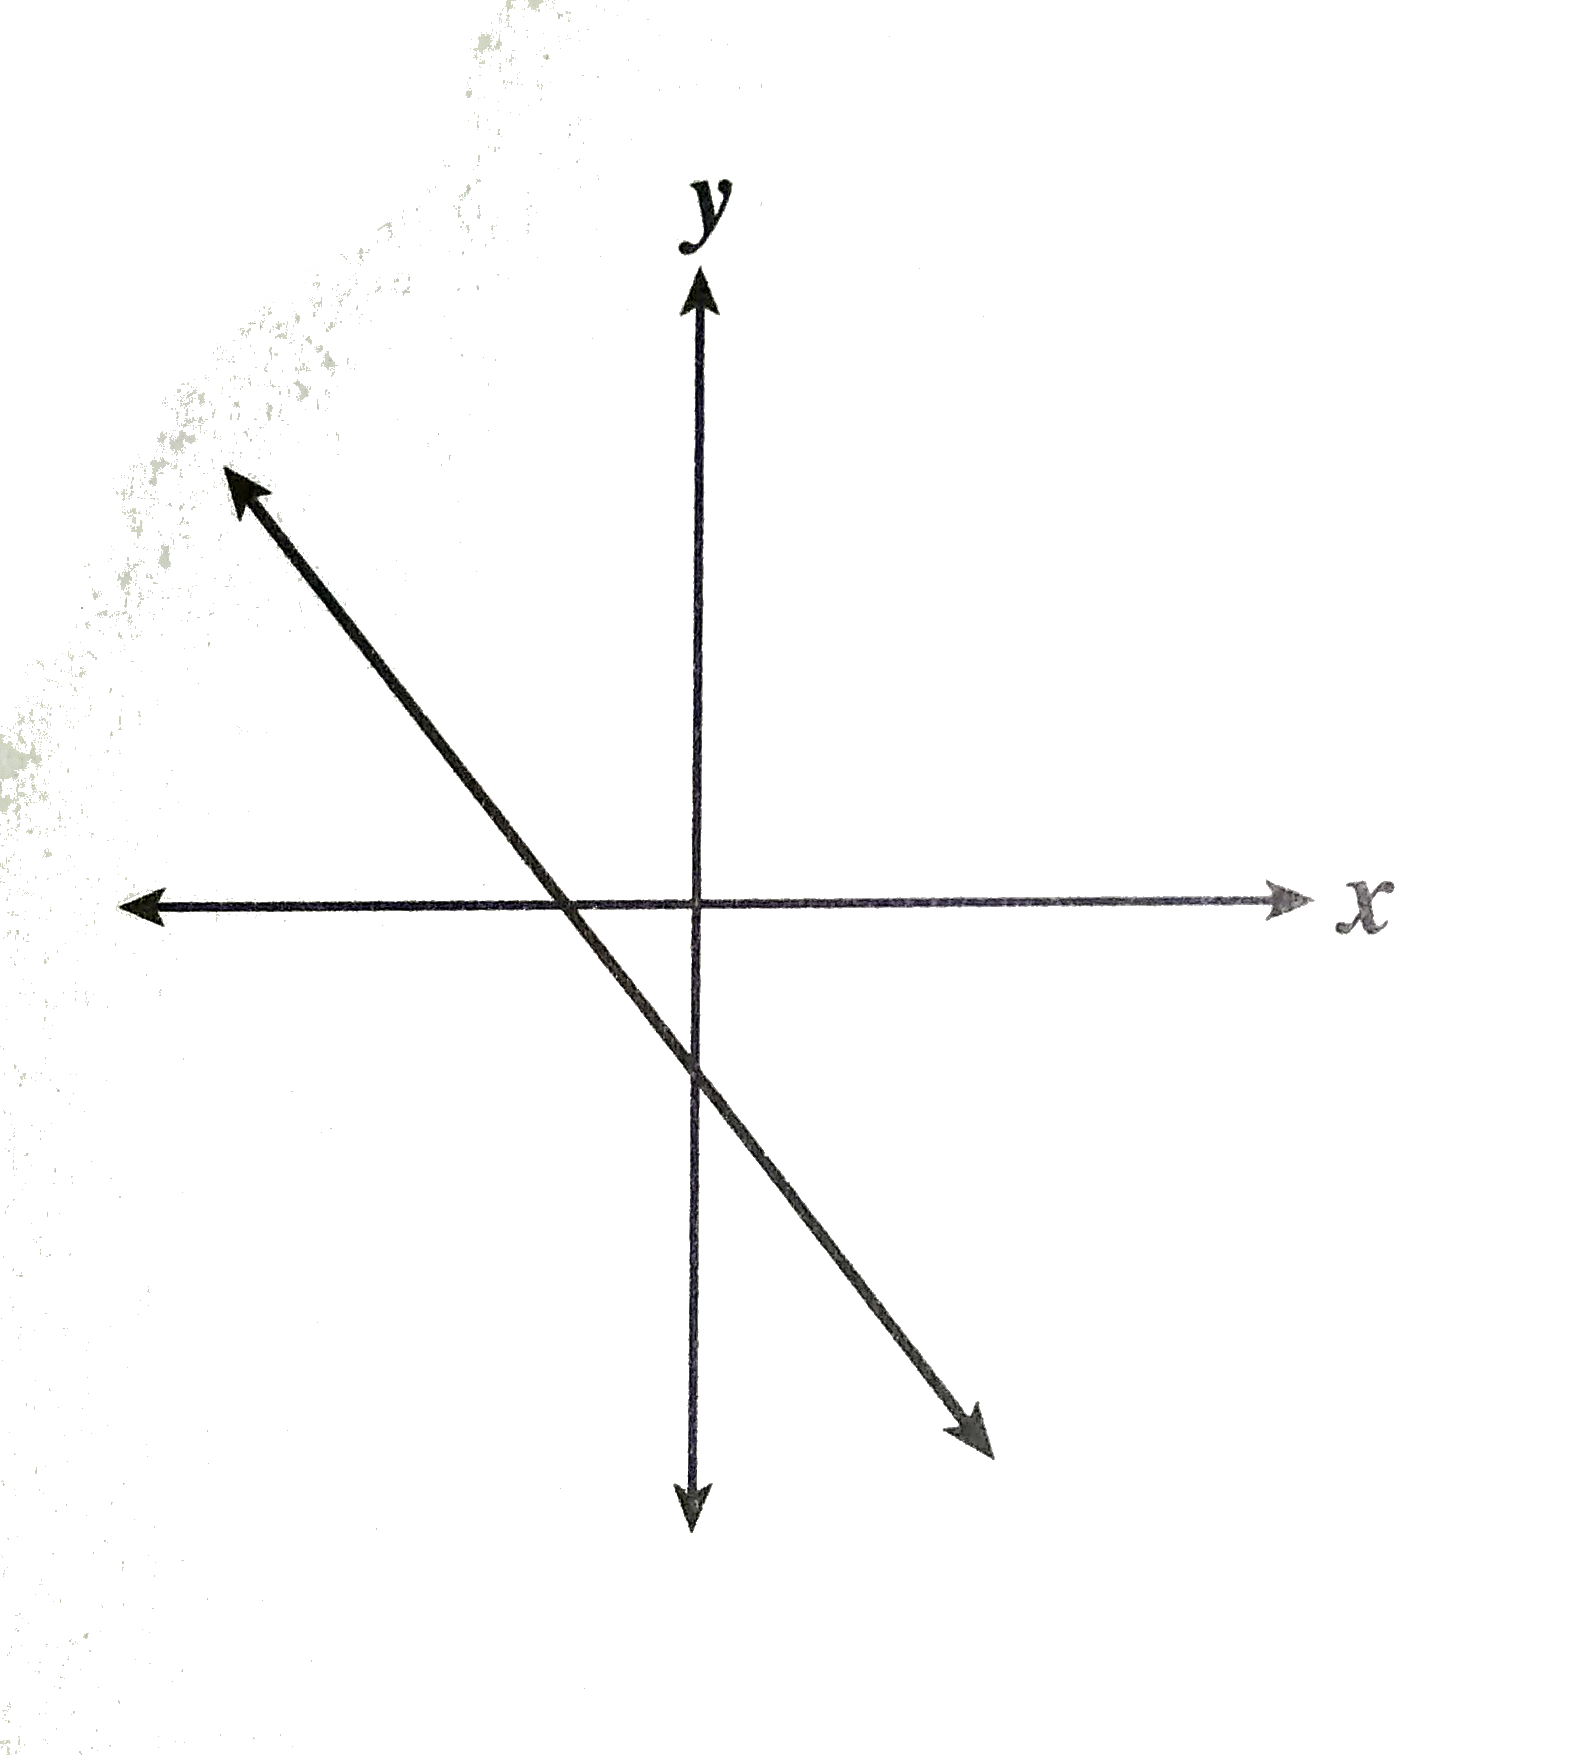
The graph above could represent which of the following equations?View Solution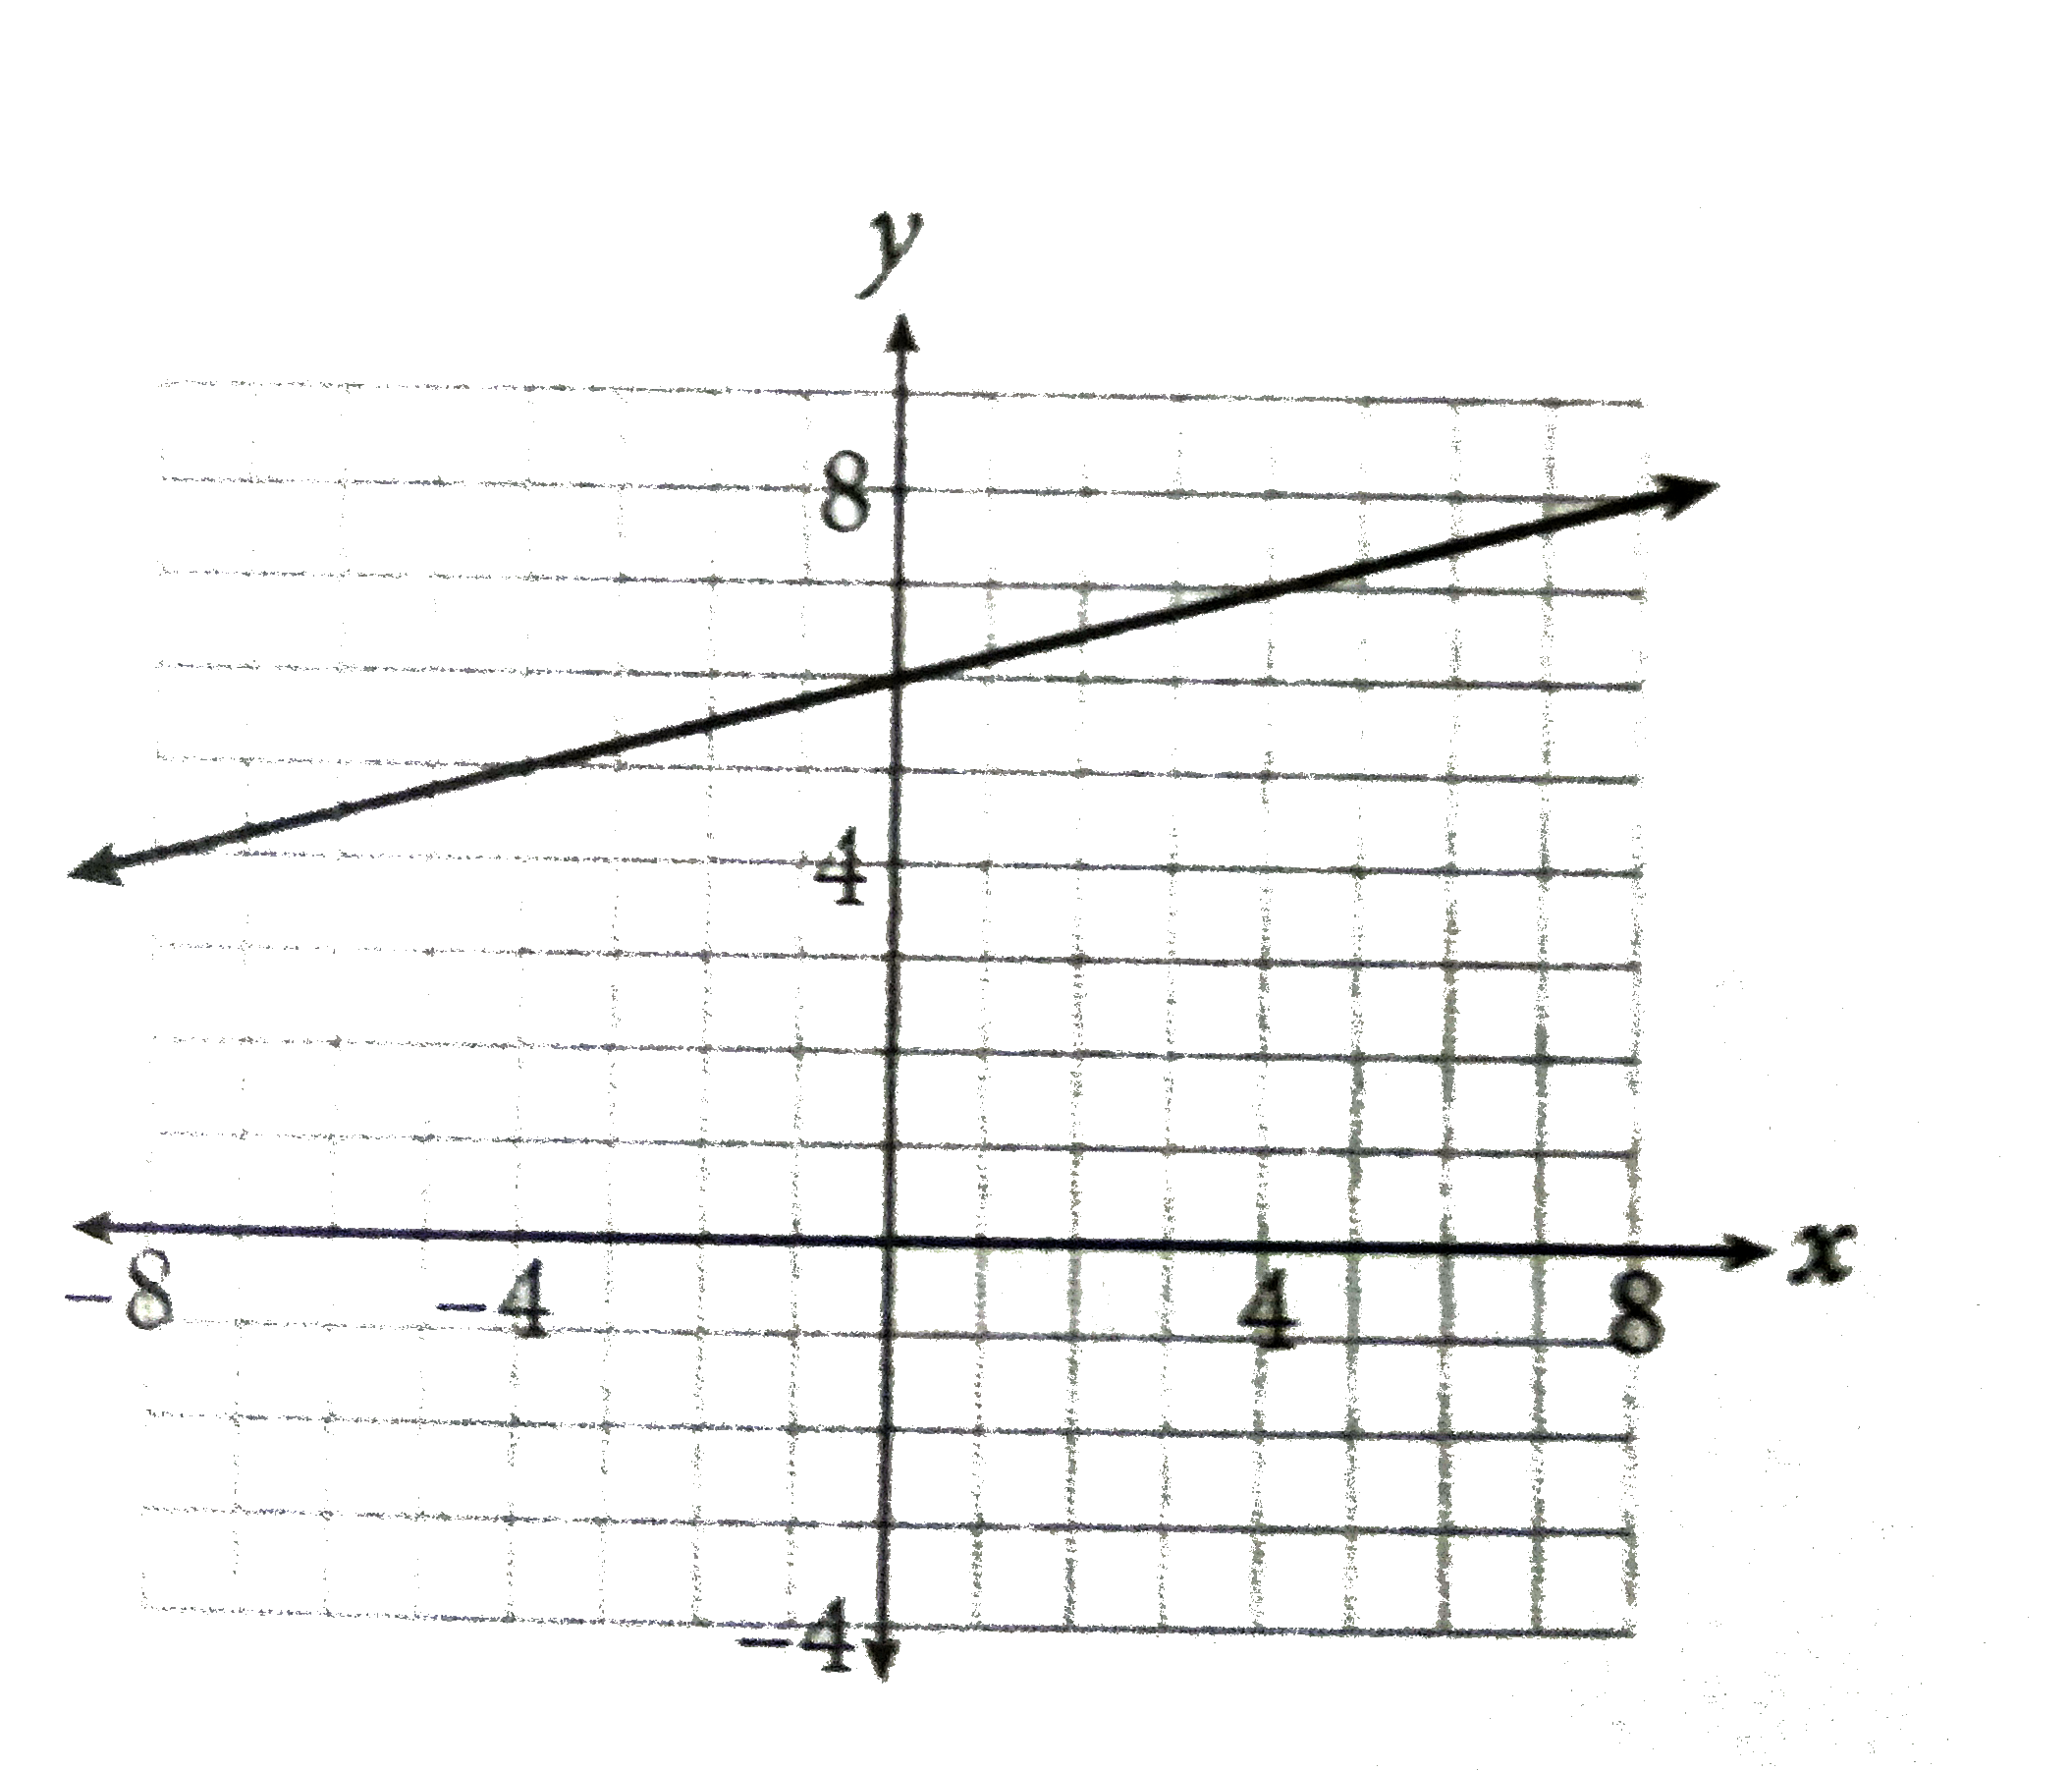
Which of the following equations represents the line shown in the graph?View SolutionThe solution of the linear inequality in x represented on number line as
 View Solution


