The marks obtained by 40 students of class VIII in an examination are given below: 16,17,18,3,7,23,18,13,10,21,7,1,13,21,13,15,19,24,16,3, 23,5,12,18,8,12,6,8,16,5,3,5,0,7,9,12,20,10,2,23 Divide the data into five groups, namely 0-5, 5-10, 10-15, 15-20 and 20-25 and prepare a grouped frequency table.
first, arranging the given data in ascending order.
4,5,7,7,13,14,15,16,17,17,19,24,25,26,27,28,30,31,31,34,34,35,35,36,36,42,44,45,47,48,51,52,52,54,55,55,56,56,61,62,62,63,68,70,72,74,75,75,78,80,81,85,86,86,92,95,97.
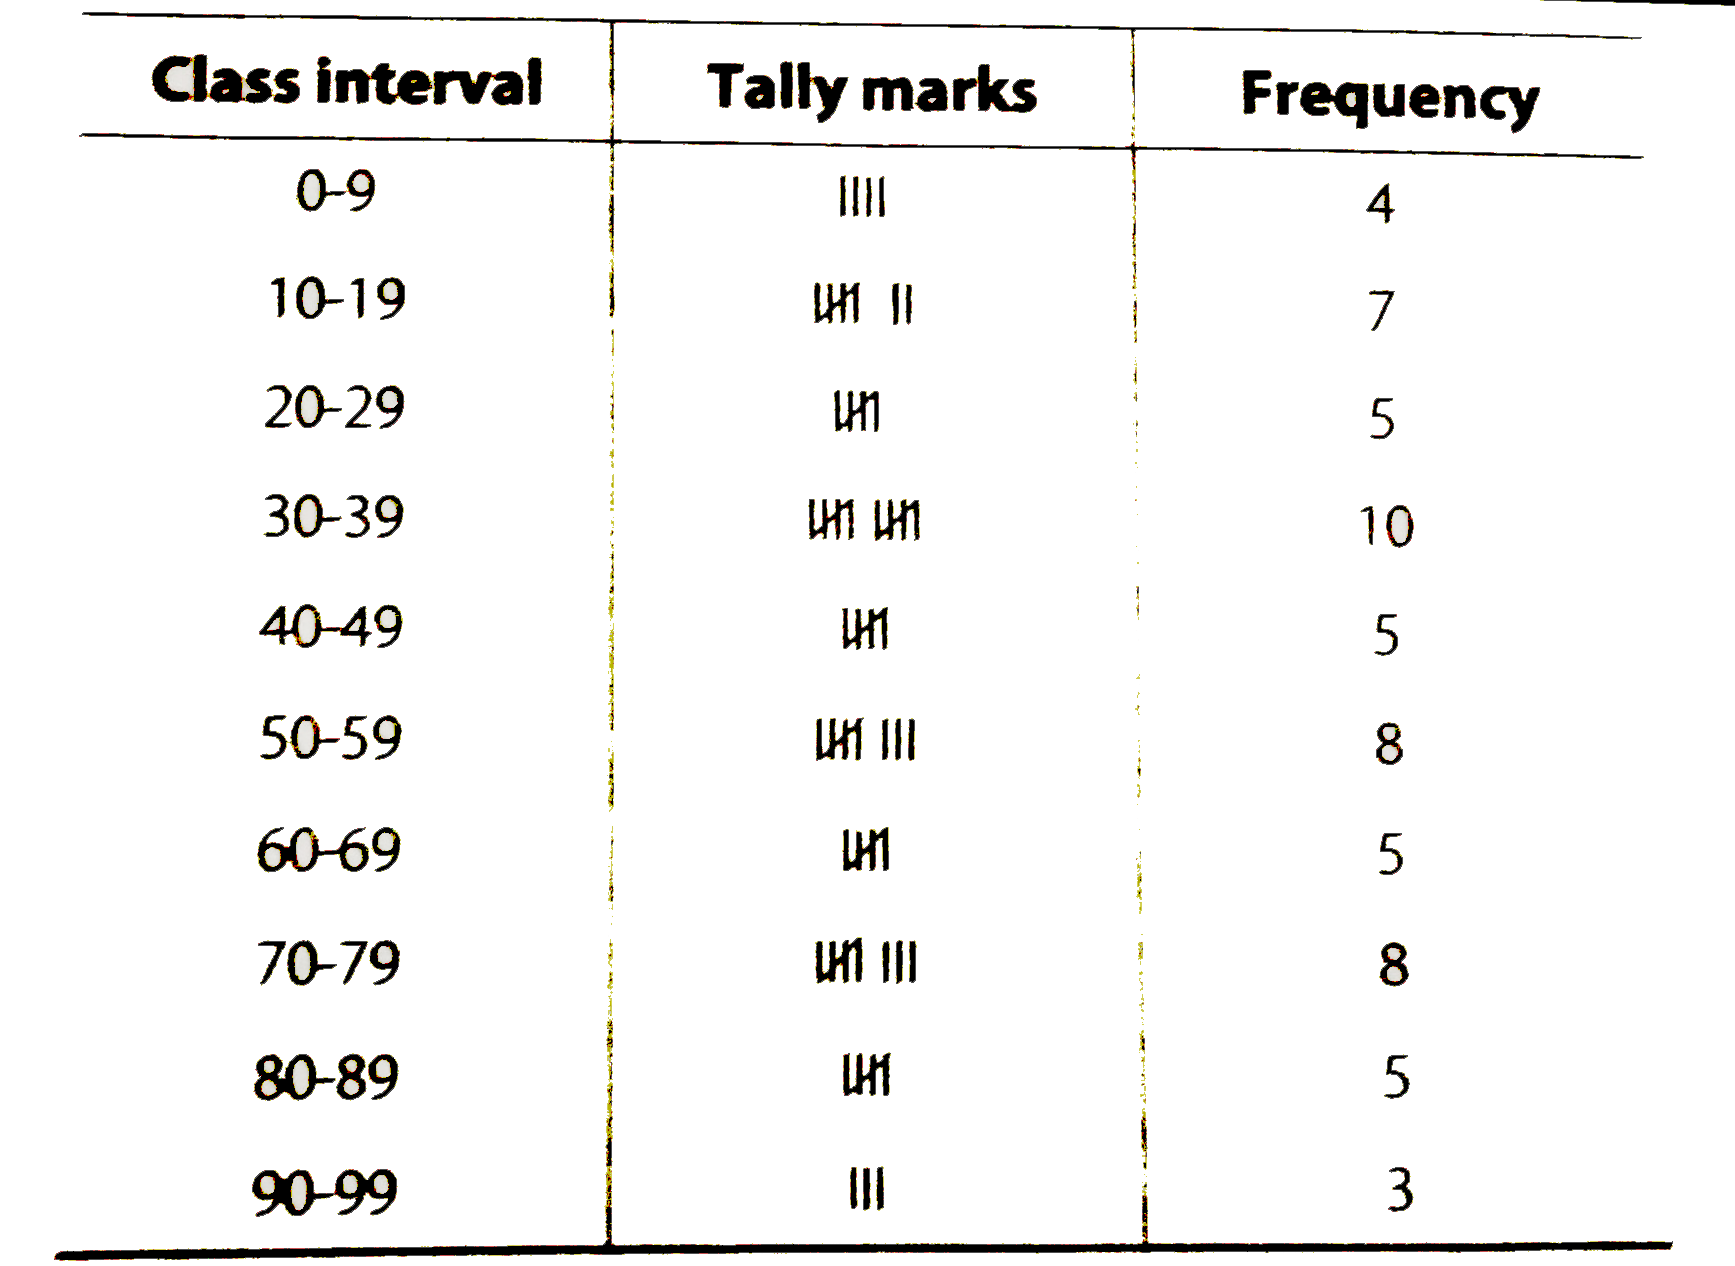
We arrange the given data into groups like 0-9, 10-19, 20-29,..... The class width in each case is 10.
The frequency distribution of the given data is given below

Topper's Solved these Questions
- STATISTICS AND PROBABILITYBook:NCERT EXEMPLAR ENGLISHChapter:STATISTICS AND PROBABILITYExercise:SHORT ANSWER TYPE QUESTIONS
Explore 20 Videos
- QUADRILATERALS Book:NCERT EXEMPLAR ENGLISHChapter:QUADRILATERALS Exercise:LONG ANSWER TYPE QUESTIONS
Explore 18 Videos
- TRIANGLESBook:NCERT EXEMPLAR ENGLISHChapter:TRIANGLESExercise:LONG ANSWER TYPE QUESTIONS
Explore 21 Videos
Similar Questions
The marks obtained by 40 students of class VIII in an examination are given below: 18,8,12,0,8,16,12,5,23,2,16,23,2,10,20,12,9,7,6,5,3,5, 13,21,13,15,20,24,1,7,21,16,13,18,23,7,3,18,17,16 Present the data in the form of a frequency distribution using the same class size, one such class being 15-20 (where 20 is not included).
View SolutionThe marks obtained by 40 students of class IX in an examination are given below: 18, 8, 12, 6, 8, 16, 12, 5, 23, 2, 16, 23, 2, 10, 20, 12, 9, 7, 6, 5, 3, 5, 13, 21, 13, 15, 20, 24, 1, 7, 21, 16, 13, 18, 23, 7, 3, 18, 17, 16 Present the data in the form of a frequency distribution using the same class size, one such class being 15-20 (where 20 is not included)
View Solution
Knowledge Check
. Find the median of the given data:
9,7,12,16,8,11,16,13,10A12B11C16D13
Find the mean of 5,6,17,8,9,15,23,18,10 and 24.
View SolutionThe marks of 20 students out of 25 are given below
1217227111924184823251521161191217 Prepare a frequency table for the given data.
View SolutionFind the median of :
16, 9, 11, 23, 7, 5, 12, 14, 8, 10, 21
View SolutionFind the median of :
25, 18, 13, 20, 16, 9, 22, 8, 6, 15, 21, 11, 17
View SolutionFollowing are the marks obtained by 30 students in an examination :
152089101617202430444738364027252830197112131413747232017
Taking class intervals 0-10 , 10-20,............ ., 40-50, construct a frequency table.
View SolutionFind the standard deviation from the following observations:
15,18,13,20,17,10,16,19,22,20.
View SolutionFind the mean deviation using median for the following observations:
(a) 17,25,9,12,18,26,21
(b) 6,10,11,15,9,7,15,16,5
View Solution
