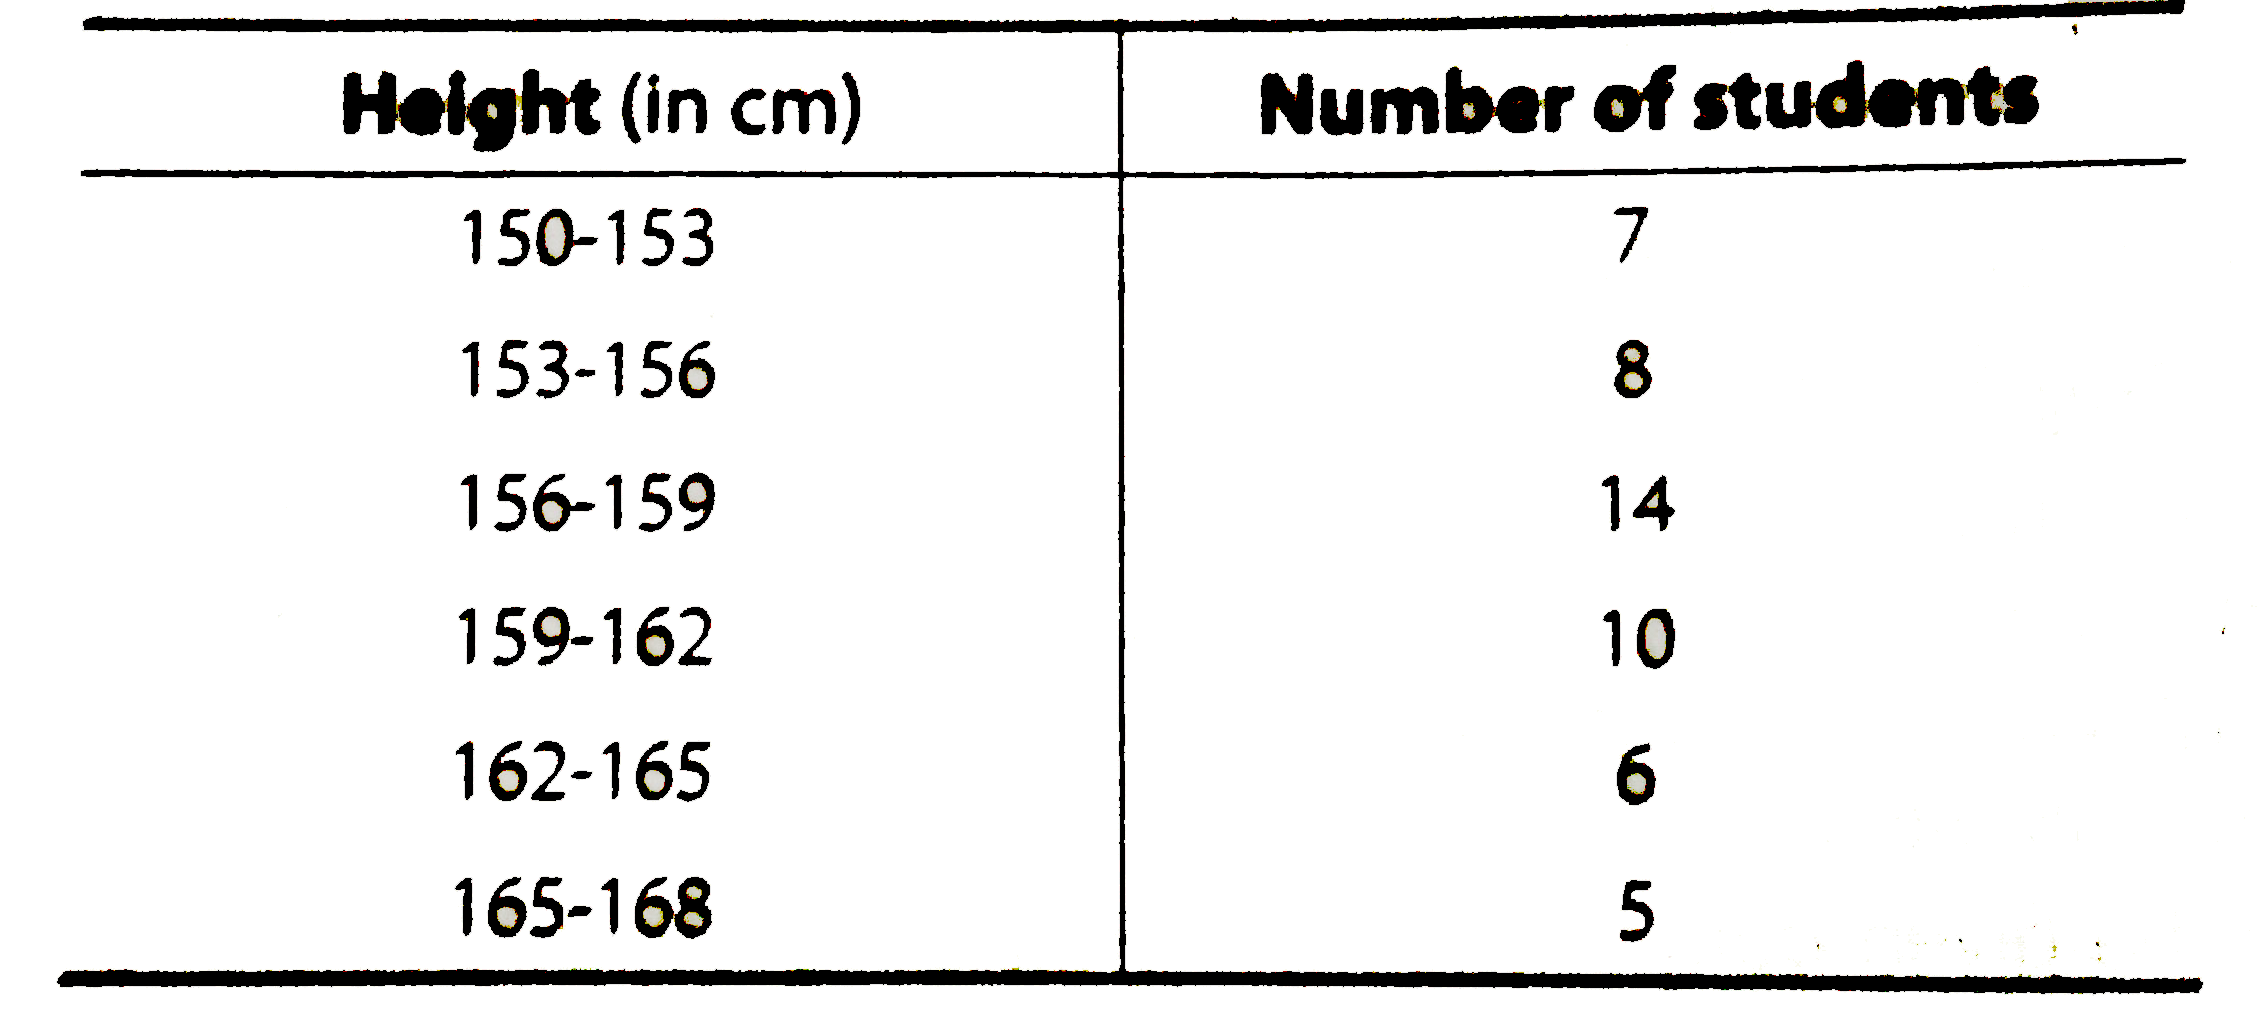
Draw a histogram of the following distribution.

Video Solution
Text Solution
Clearly, the given frequency distribution is in exclusive form.
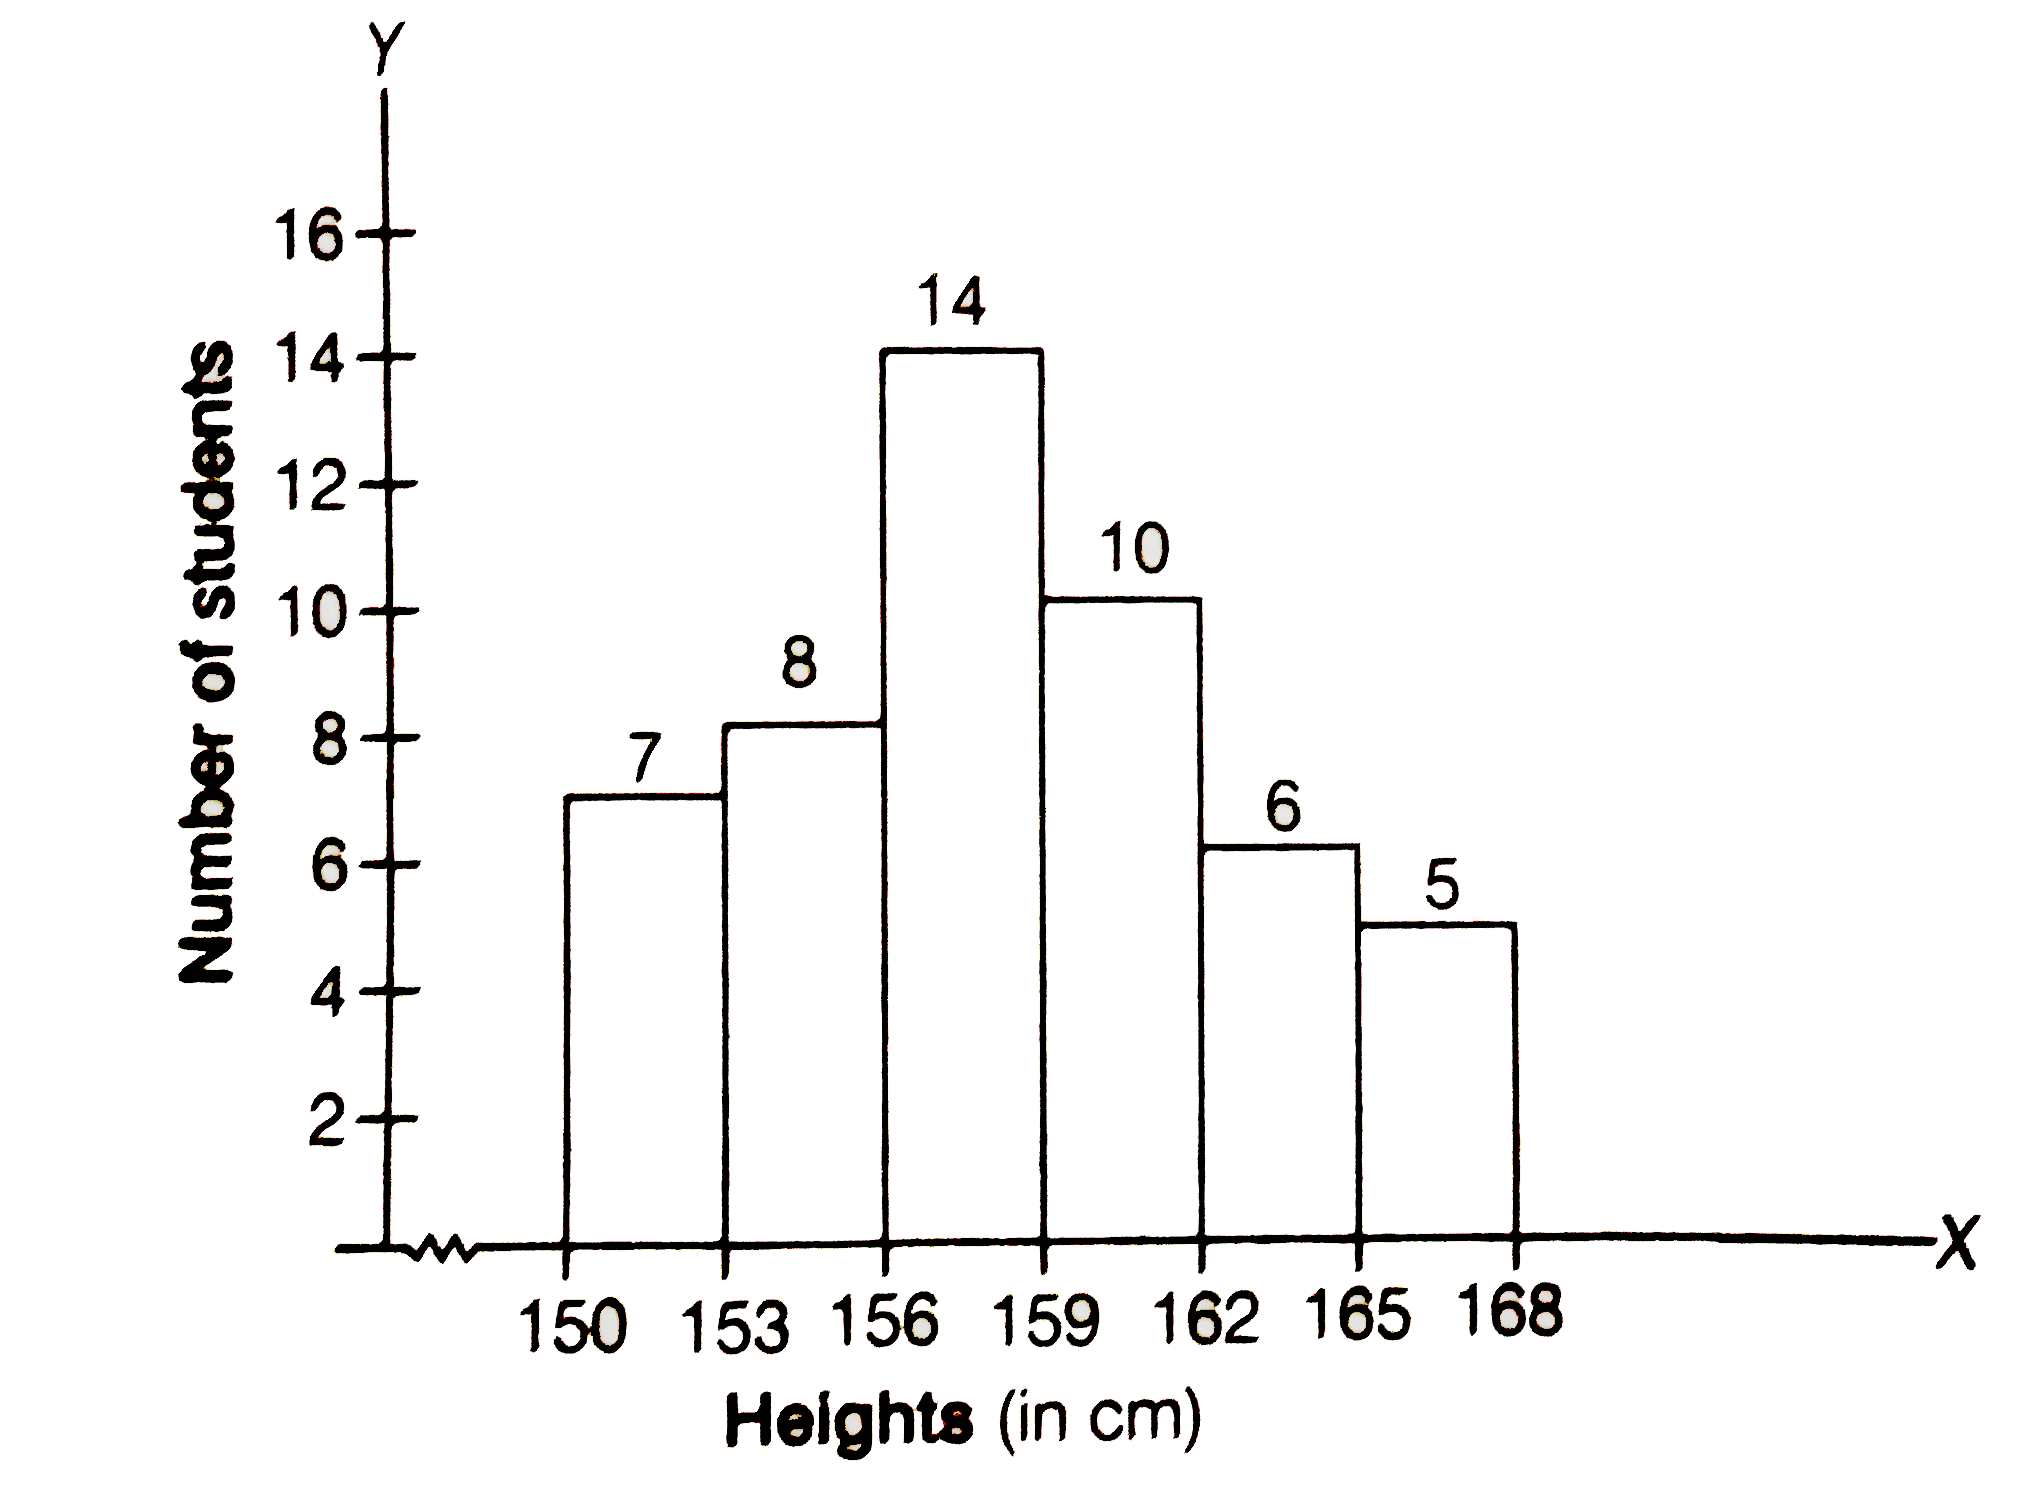
Along, the horizontal axis, we represent the class intervals of heights on some suitable scale. The corresponding frequencies of number of students are represented along the vertical axis on a suitable scale.
Since, the given intervals start with 150-153. It means that there is some break is indicated near the origin to signify the graph is drawn with a scale beginning at 150. A histrogram of the given distribution is given below.

|
Topper's Solved these Questions
- STATISTICS AND PROBABILITYBook:NCERT EXEMPLAR ENGLISHChapter:STATISTICS AND PROBABILITYExercise:SHORT ANSWER TYPE QUESTIONS
Explore 20 Videos
- QUADRILATERALS Book:NCERT EXEMPLAR ENGLISHChapter:QUADRILATERALS Exercise:LONG ANSWER TYPE QUESTIONS
Explore 18 Videos
- TRIANGLESBook:NCERT EXEMPLAR ENGLISHChapter:TRIANGLESExercise:LONG ANSWER TYPE QUESTIONS
Explore 21 Videos
Similar Questions
Draw a histogram for the following data:

View SolutionDraw a histogram for the following data:

View SolutionDraw a histogram for the following data:

View SolutionDraw a histogram for the following data:

View SolutionConstruct a histogram for the following distribution:

View SolutionDraw a histogram for the following data :

View SolutionDraw a histogram from the following data:

View SolutionMode of the following distribution is

View SolutionDraw an ogive for the following distribution

Use the ogive drawn to determine:
the median income,
View SolutionDraw an ogive for the following distribution

Use the ogive drawn to determine:
the number of employees whose income exceeds Rs 190
View Solution