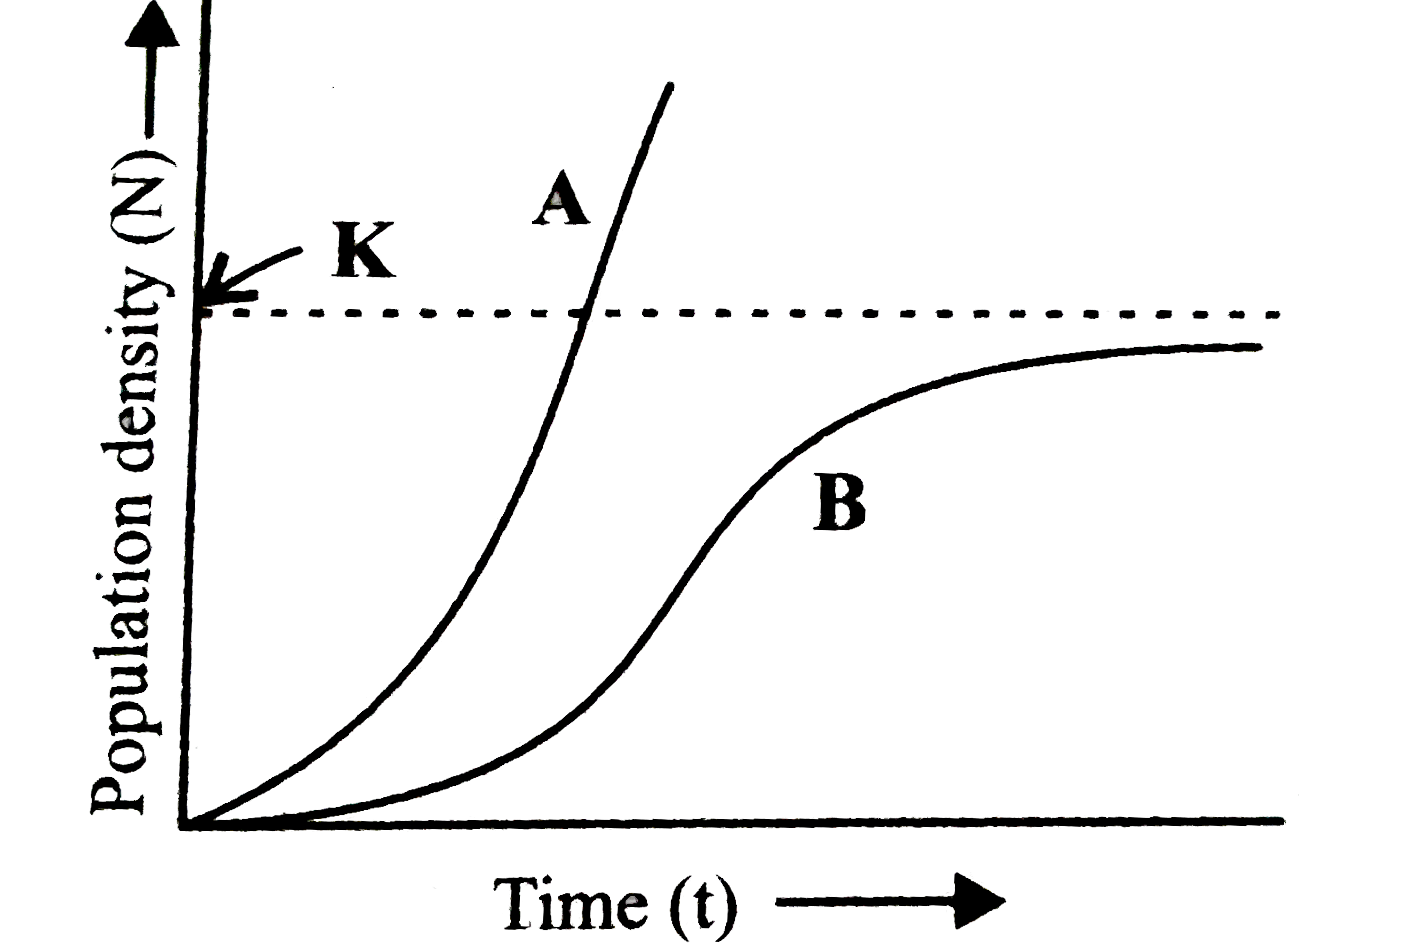
(a) Name the two growth models that represent population growth and draw the respective growth curves they represent.
(b) State the basis for the difference in the shape of these curves.
(c) Which one of the curves represent the human population growth at present? Do you think such a curve is sustainable ? Give reason in support of your answer.
Video Solution
Text Solution
The two growth models are :
1. Logistic growth
2. Exponential growth
(b) The difference in growth curves is due to the difference in availability of resources. In logistic growth the resources available are limited resulting in a sigmoid curve. In exponential growth the resources are unlimited resulting in a J shaped curve.
(c) The human population growth is represented by the exponential growth curve. The curve is not sustainable become sooner or later resource (food and space ) it self becomes limiting for the vast population leading to a logistic growth pattern
|
Updated on:21/07/2023
Similar Questions
Knowledge Check
- Question 1 - Select One
Which of the following equations corretly represents the exponential population growth curve ?
AdN/dt=rNBdN/dt=rN(K−NK)CNt=N0ertDBoth (a) and (c) - Question 2 - Select One
Study the population growth curves (A and B) in the given graph and select the incorrect option.
 ACurve 'A' shows exponential growth, represented by equation dNdt=rN.BCurve 'B' shows logistic growth, represented by equation dNdt=rN(K−NK)CExponential growth curve is considered as more realistic than the logistic growth curve.DCurve 'A' can also be represented by equation Nt=N0ert.
Which of the following curve represents Verhulst Pearl Logistic growth in a populations ?
View SolutionArithmetic growth curve is represented by which of the following equation?
View SolutionWhich of the following represents logistic growth curve?
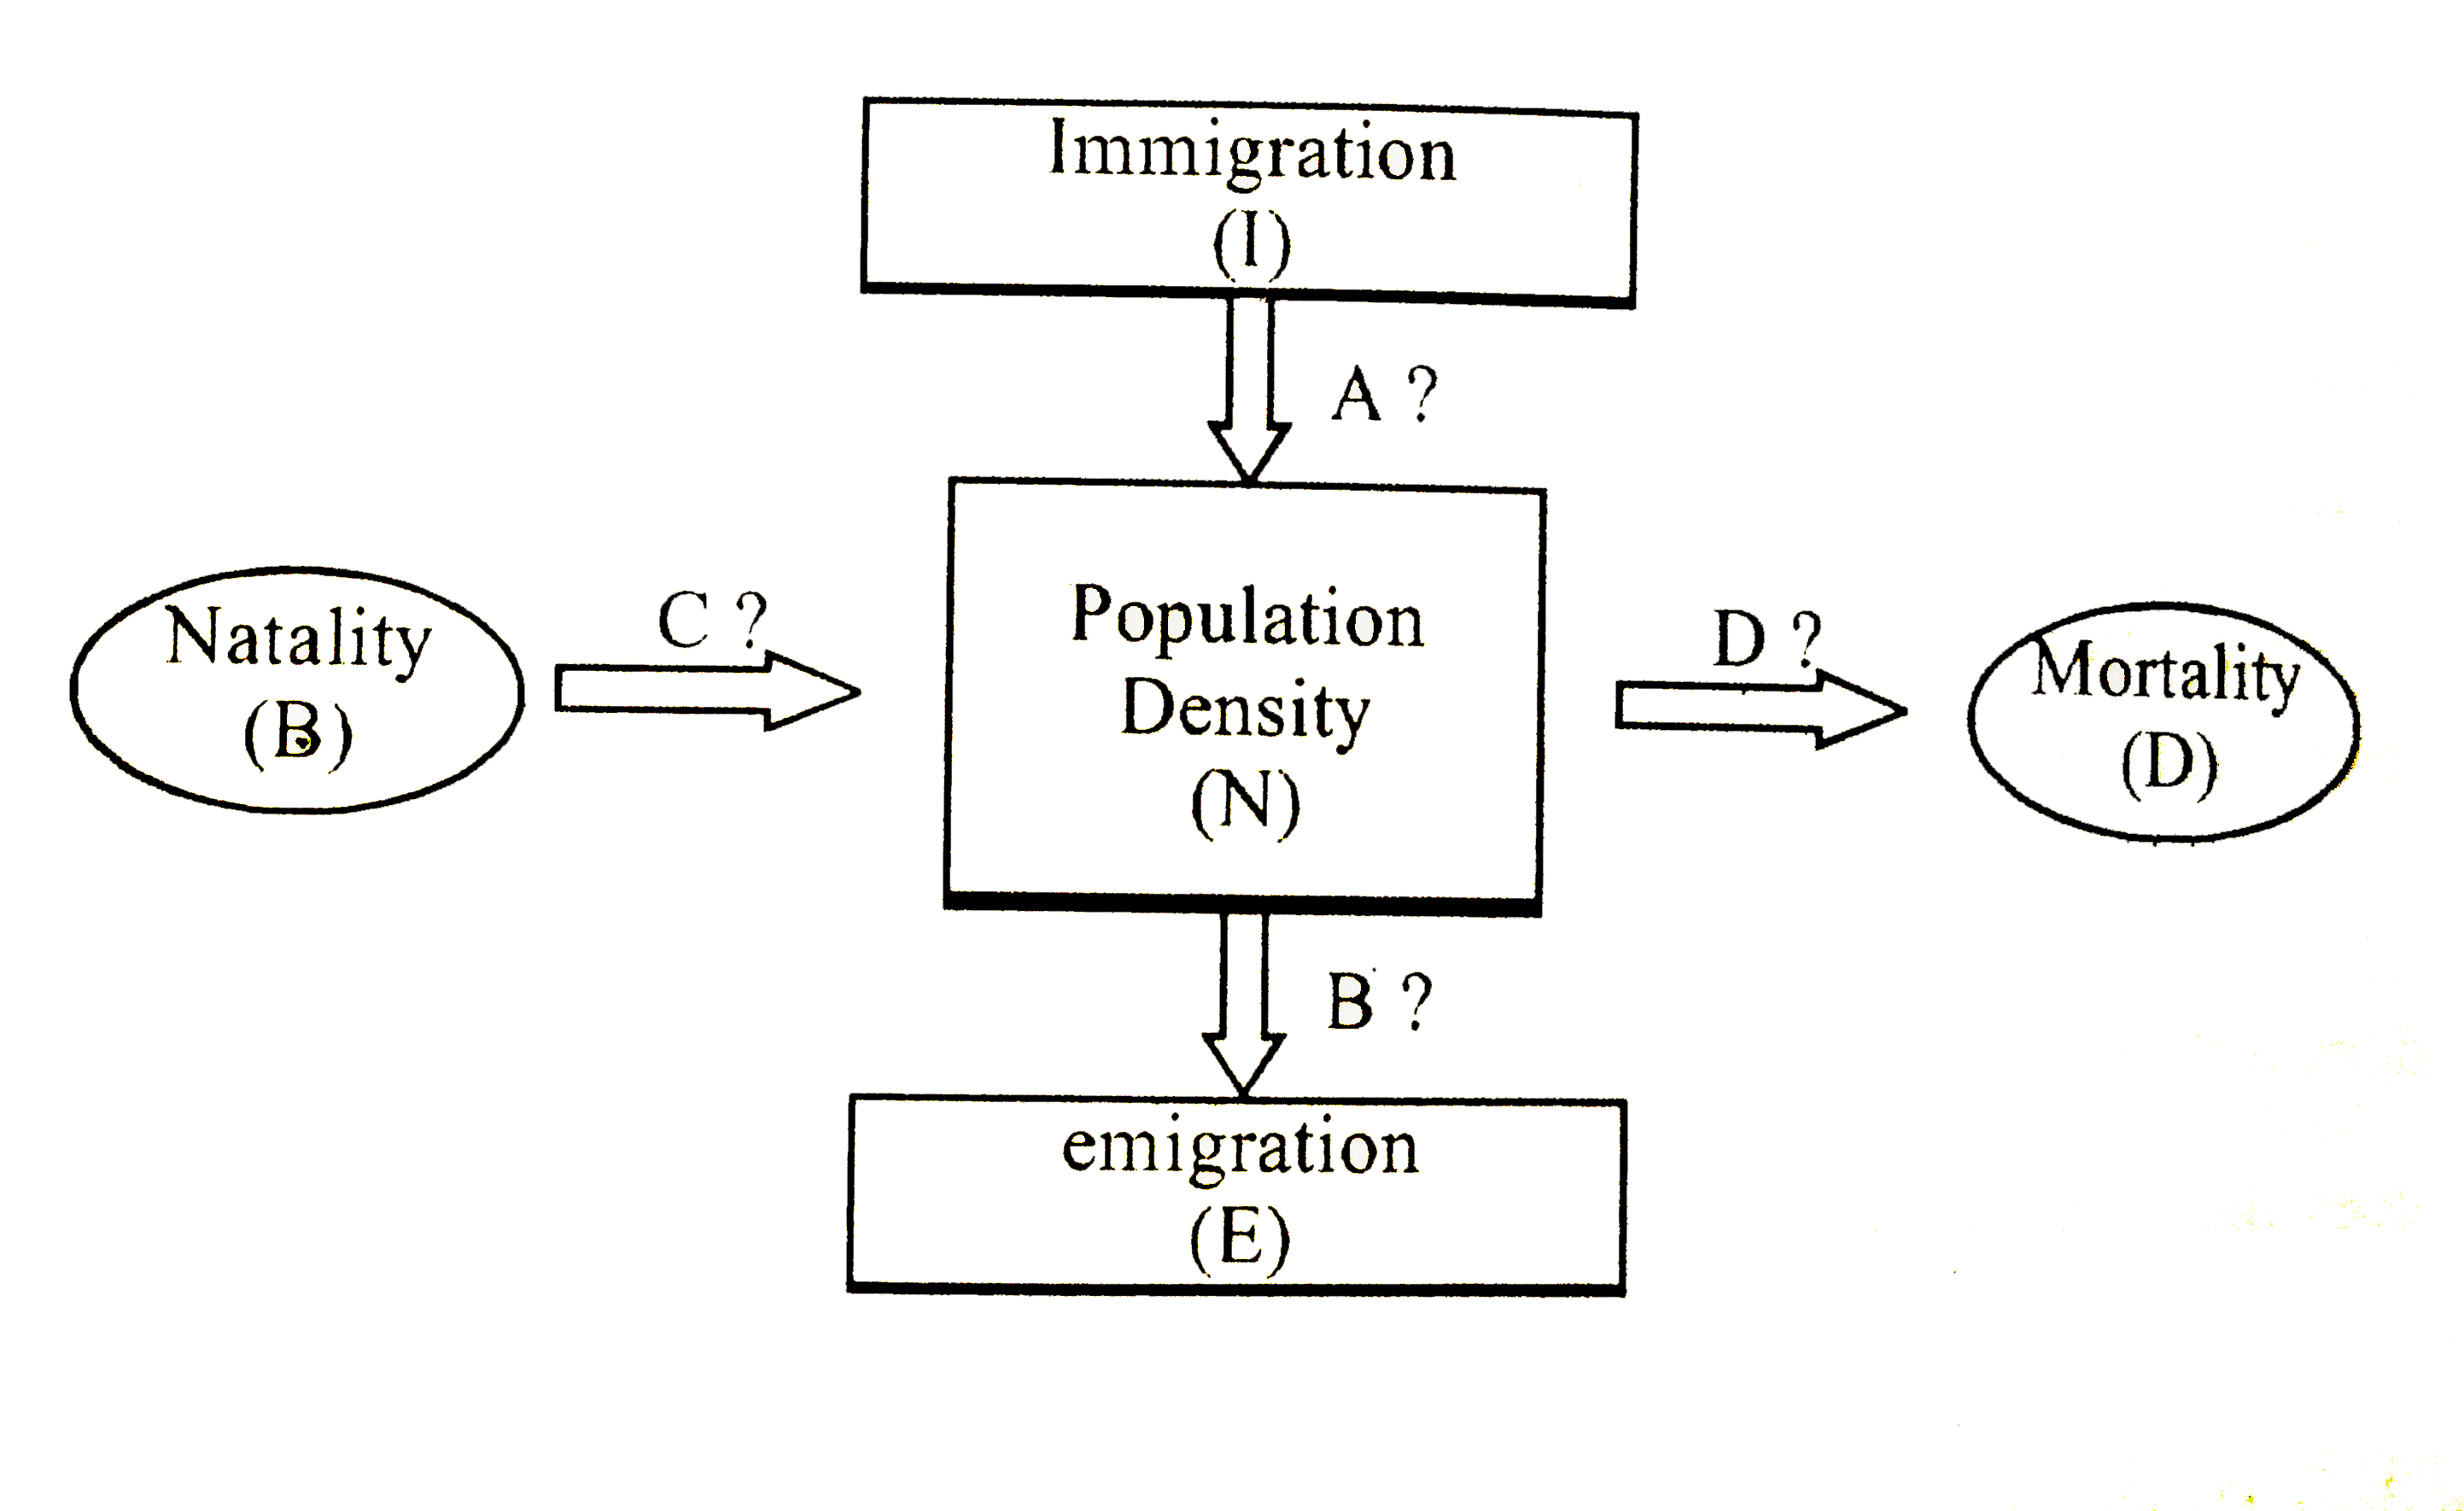
View Solution(i) Which of the following A,B,C ,d represent increases and decreases in population growth ?

View SolutionWhat does S-shaped pattern of population growth represent? How is j-shaped pattern different from it and why?
View SolutionIn signoid growth curve, upper asymptote represents period of
View Solution

