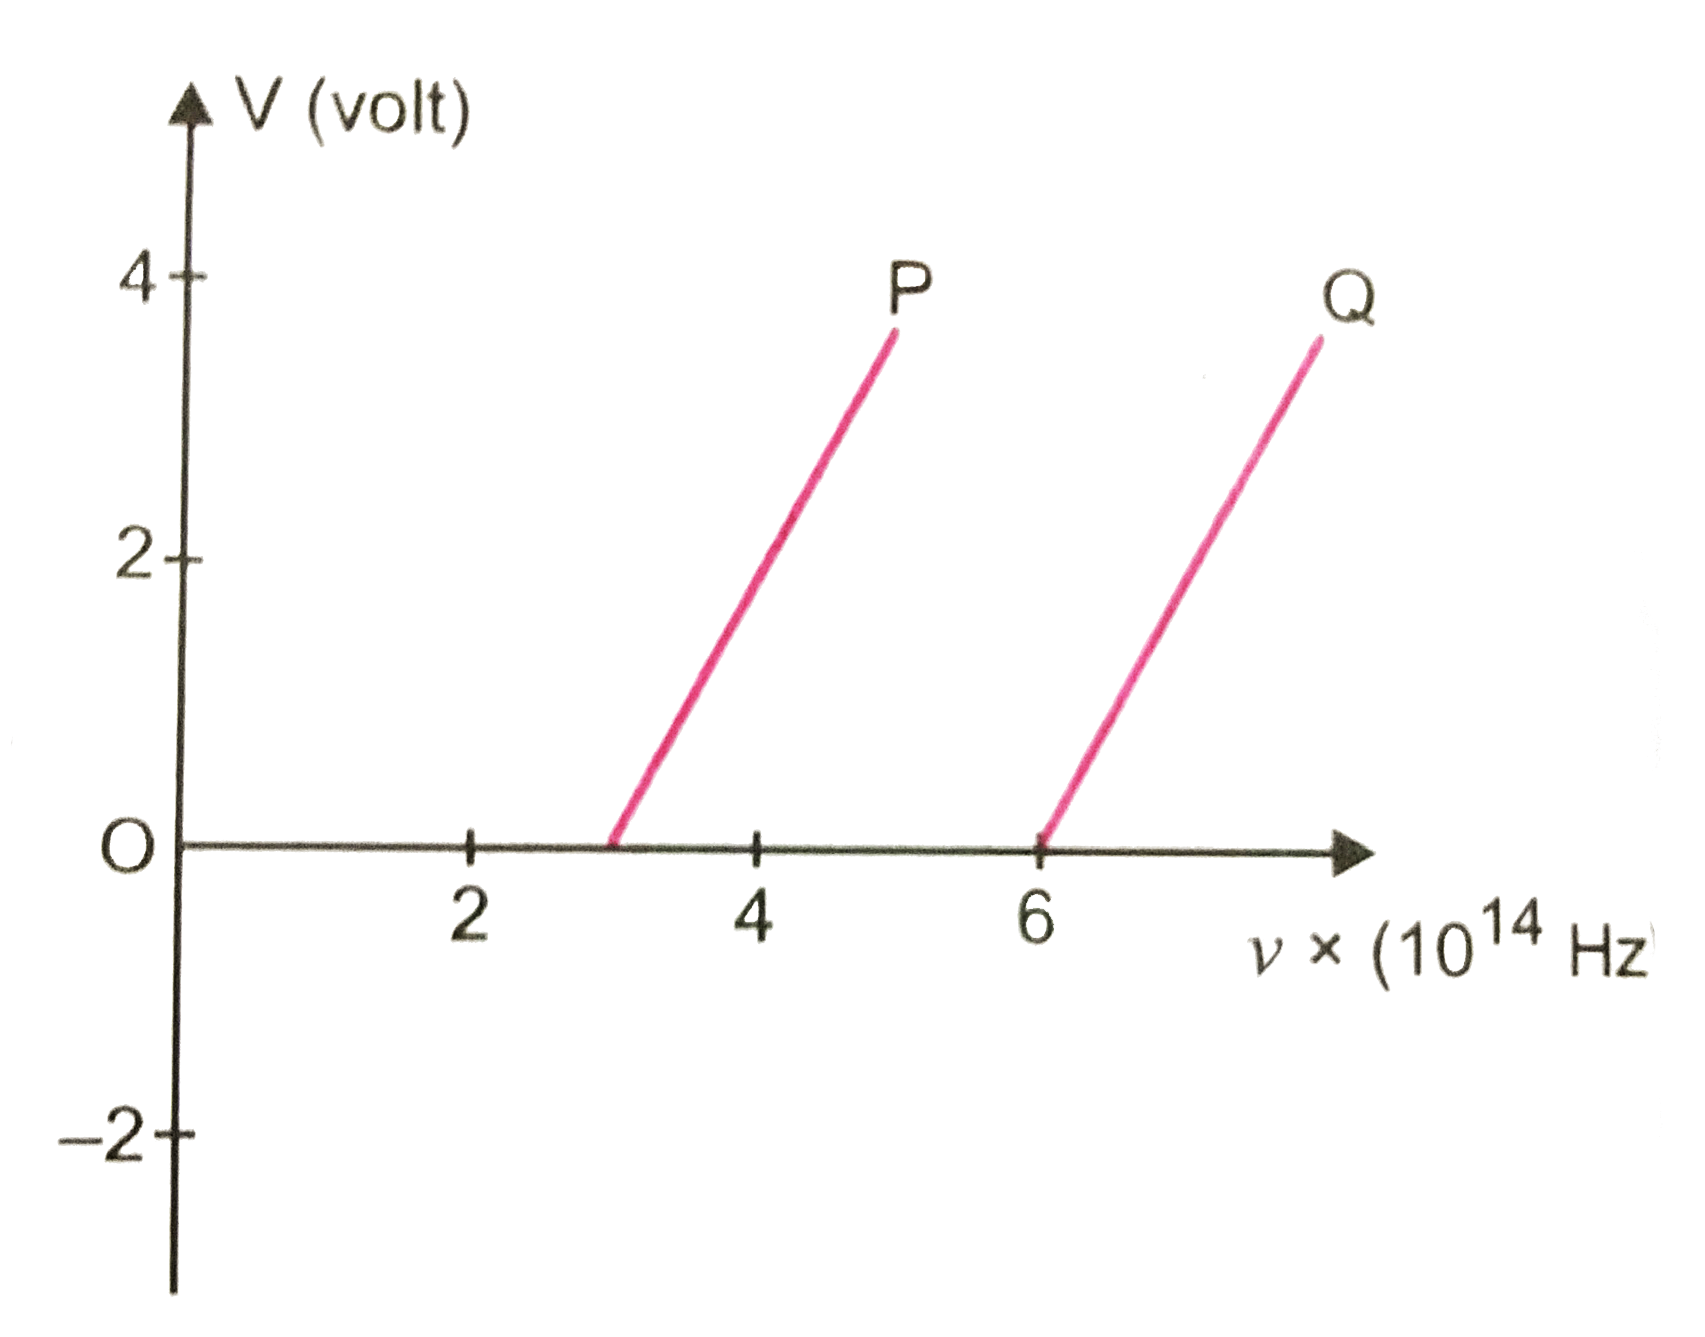
The graph shows variation of stopping potential V0 versus frequency of incident radiation v for two photosensitive metals A and B. Which of the two metals has higher threshold frequency and why?
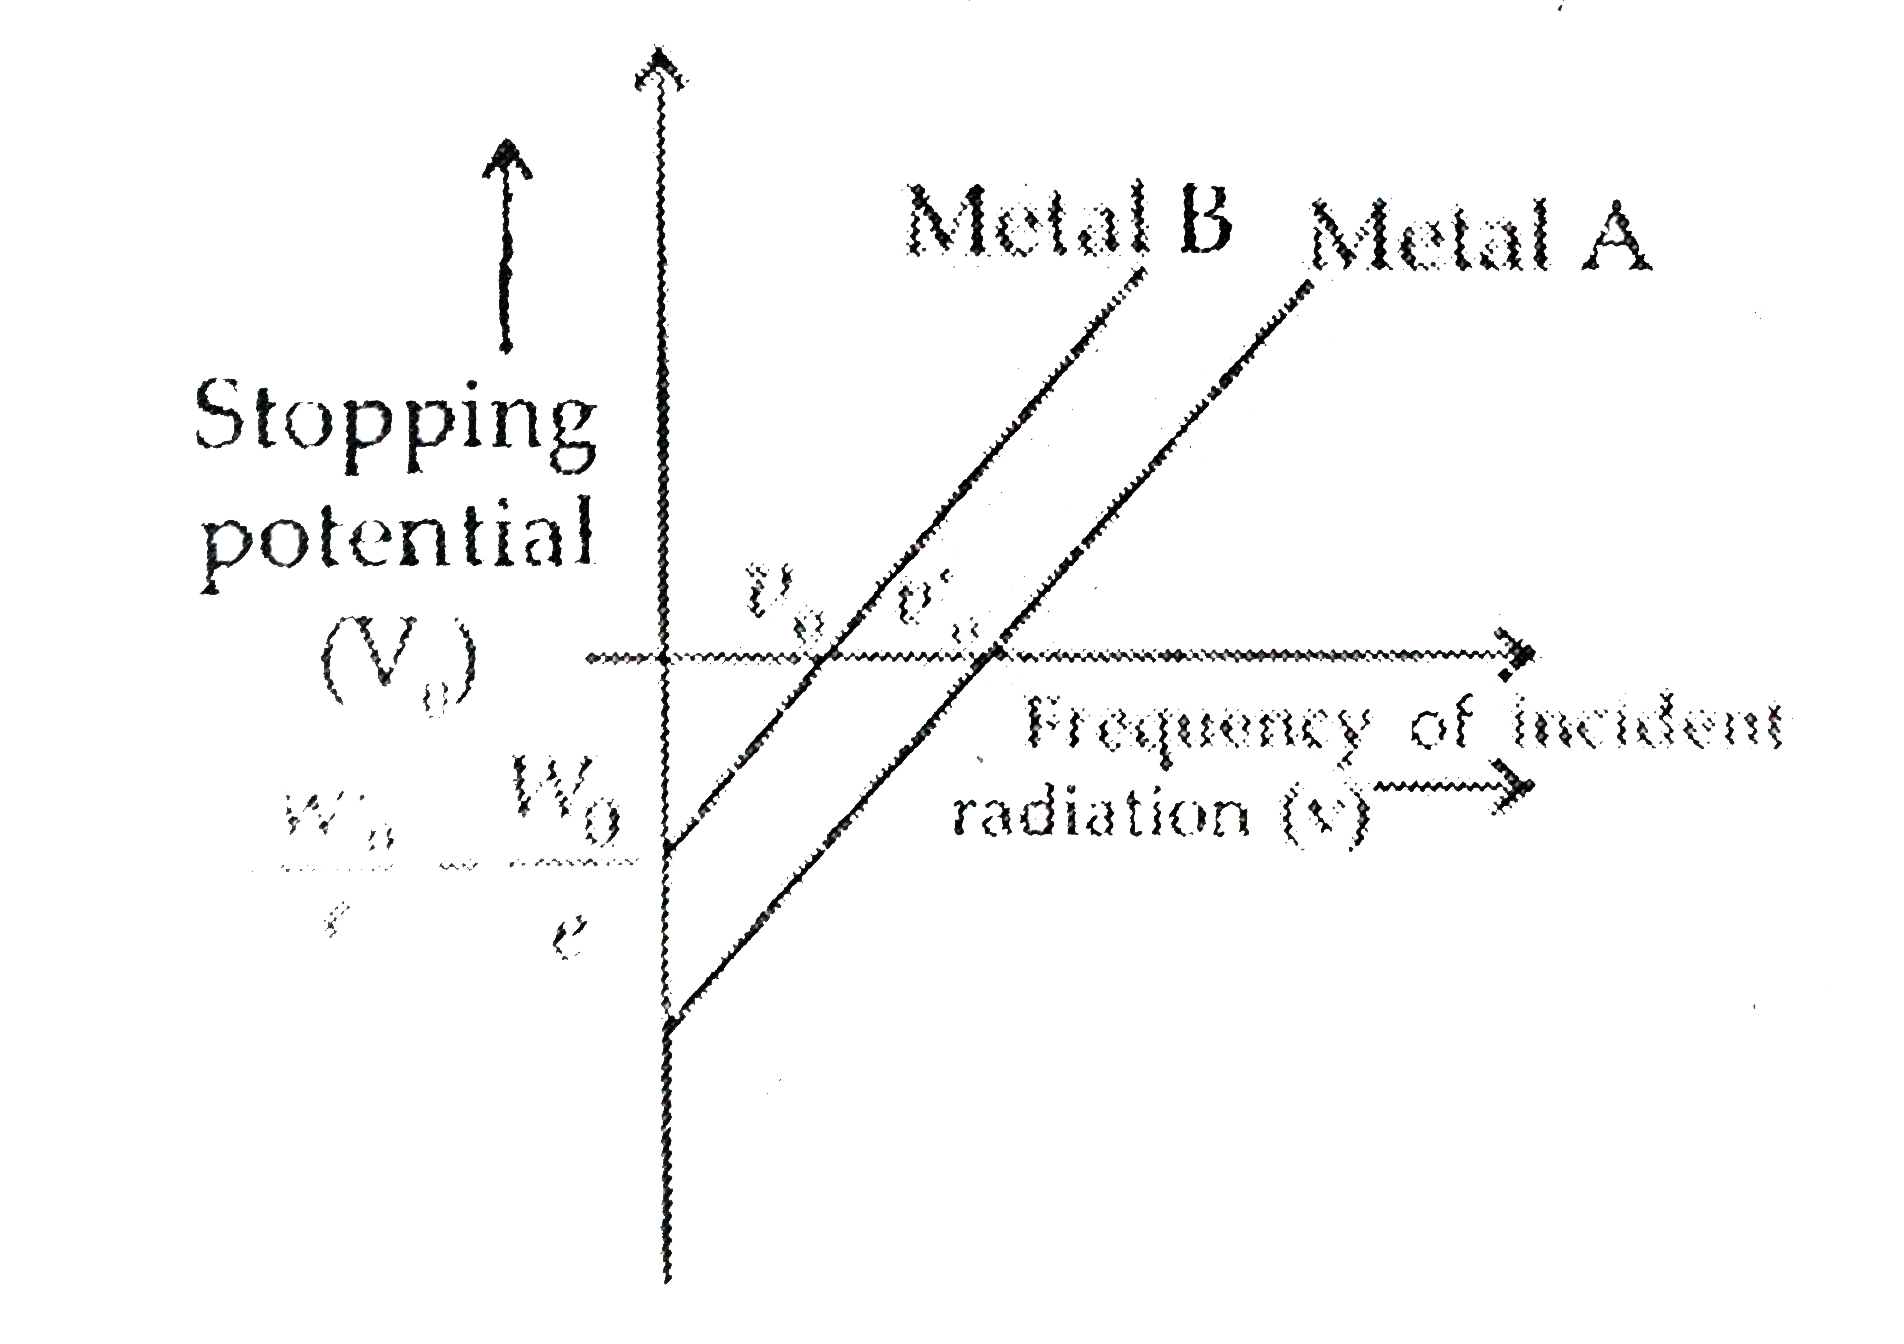
Threshold frequency of Q is more than that of P, as wave length is inversely proportional to frequency
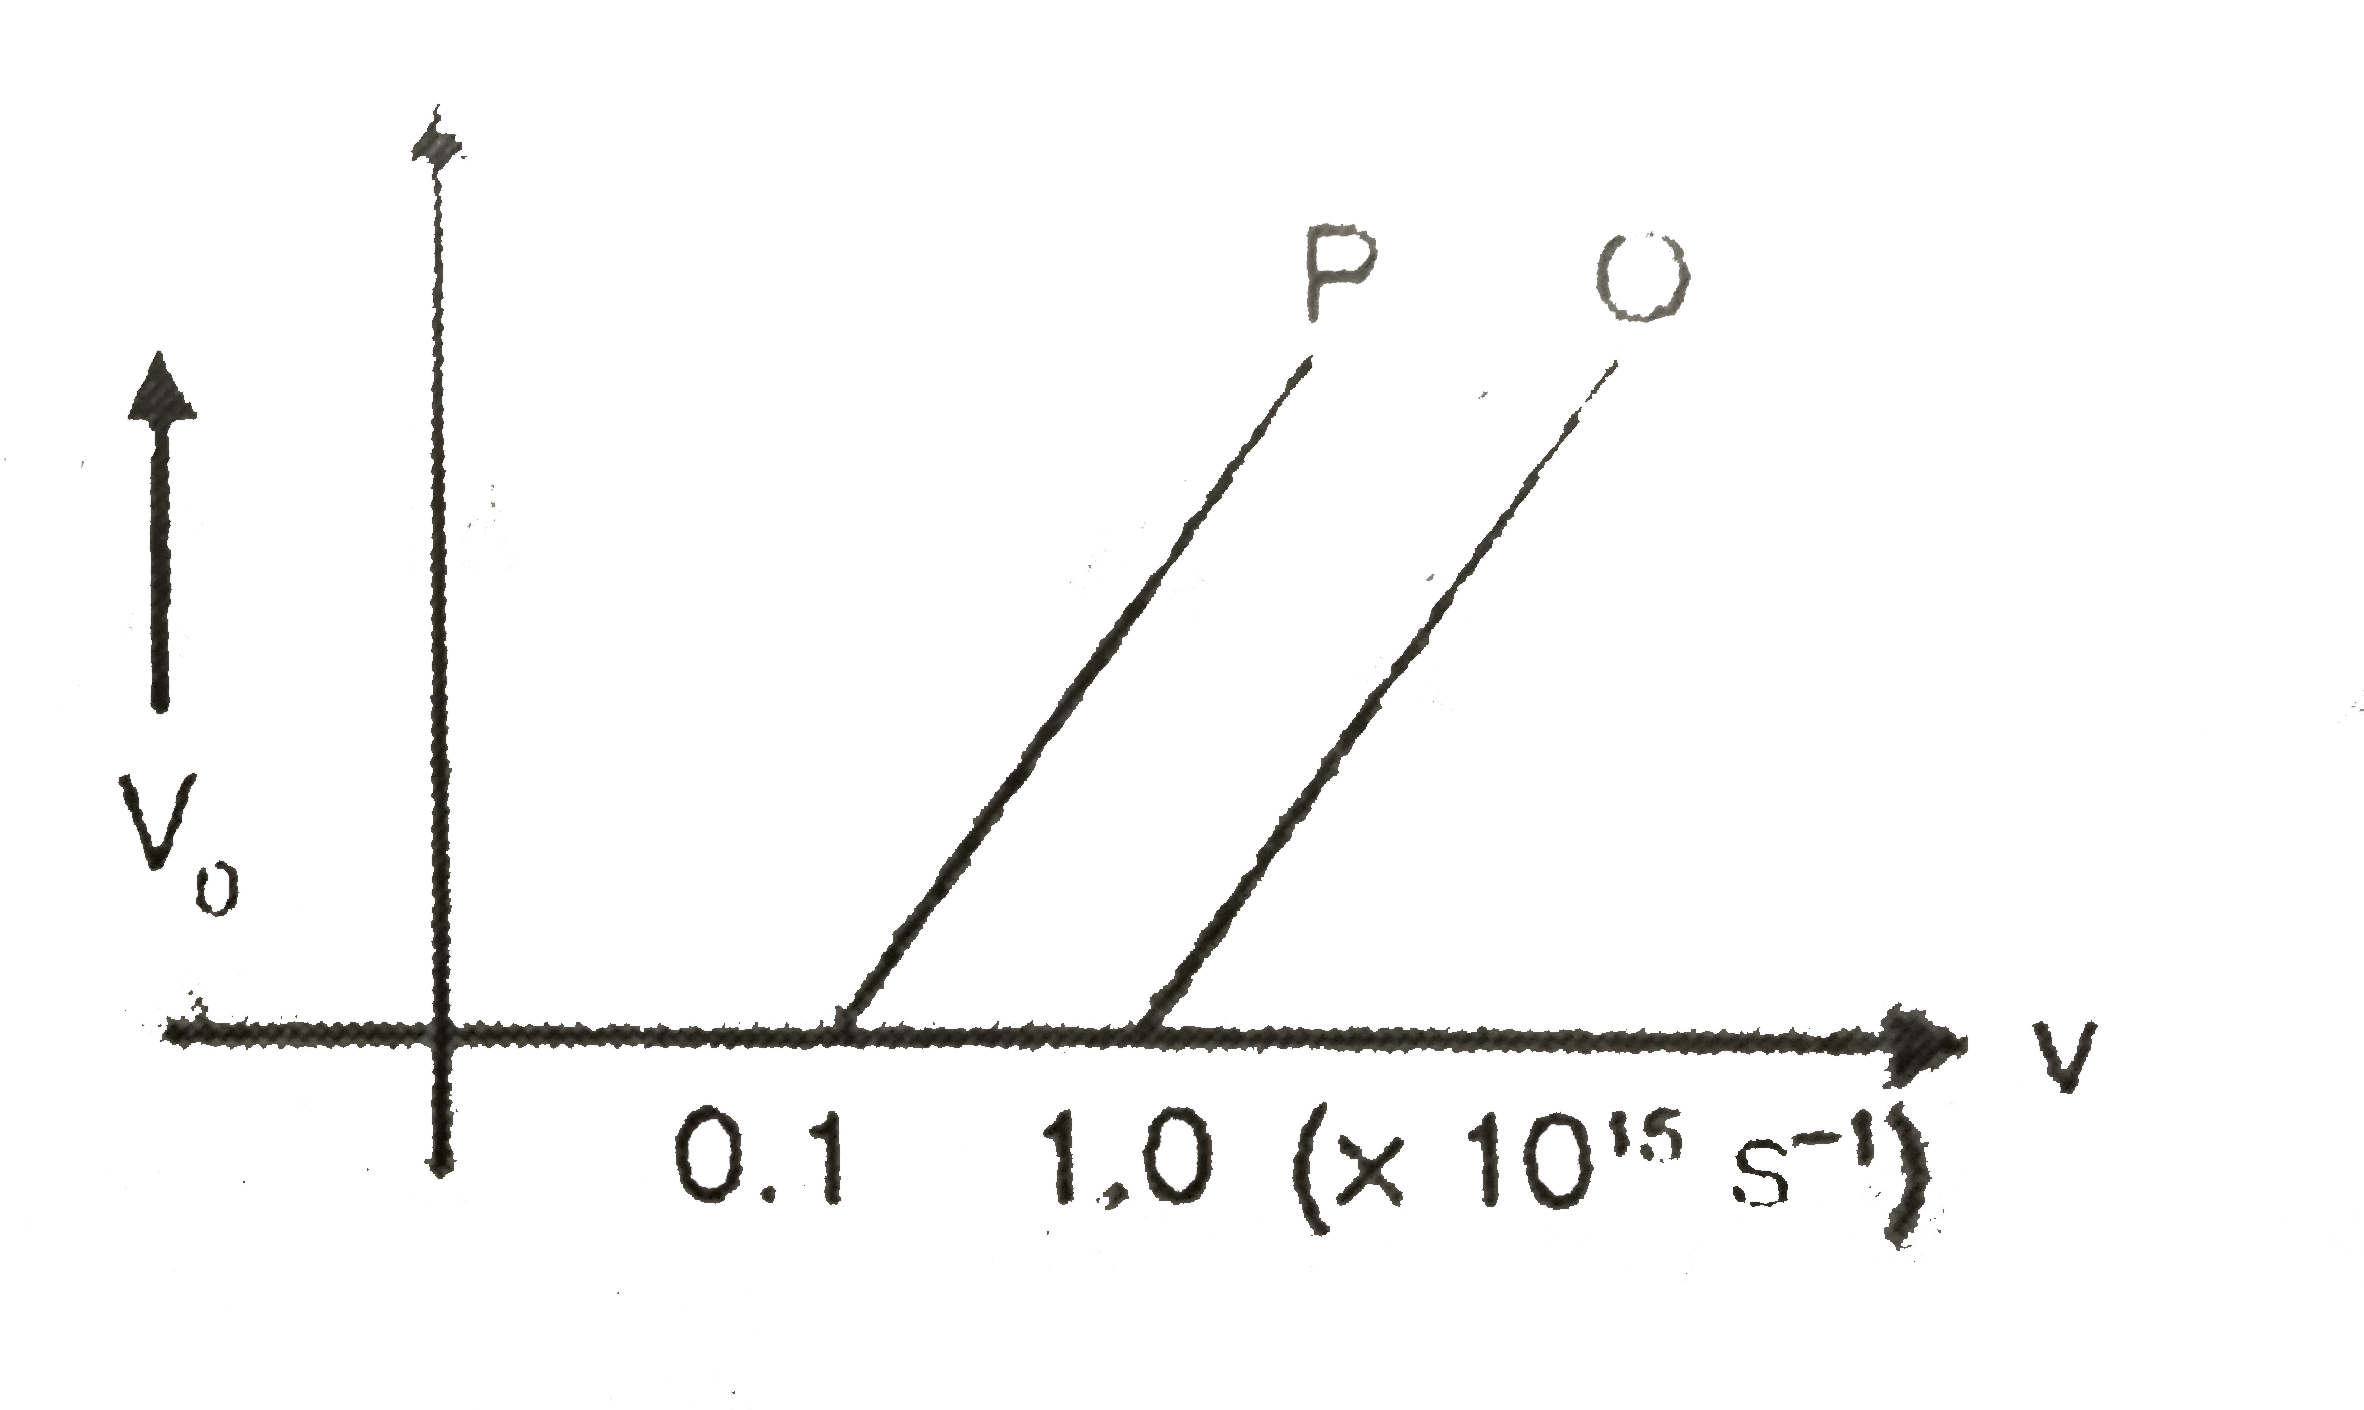
C=vλ
threshold wave length will be smaller for Q.
Topper's Solved these Questions
- BOOK - XII BOARD PREVIOUS YEAR PAPER ENGLISHCHAPTER - XII BOARDSEXERCISE - SECTION - B7videos
XII BOARDS
- BOOK - XII BOARD PREVIOUS YEAR PAPER ENGLISHCHAPTER - XII BOARDSEXERCISE - SECTION - C10videos
XII BOARDS
- BOOK - XII BOARD PREVIOUS YEAR PAPER ENGLISHCHAPTER - SAMPLE PAPER 2019EXERCISE - SECTION D6videos
SAMPLE PAPER 2019
Similar Questions
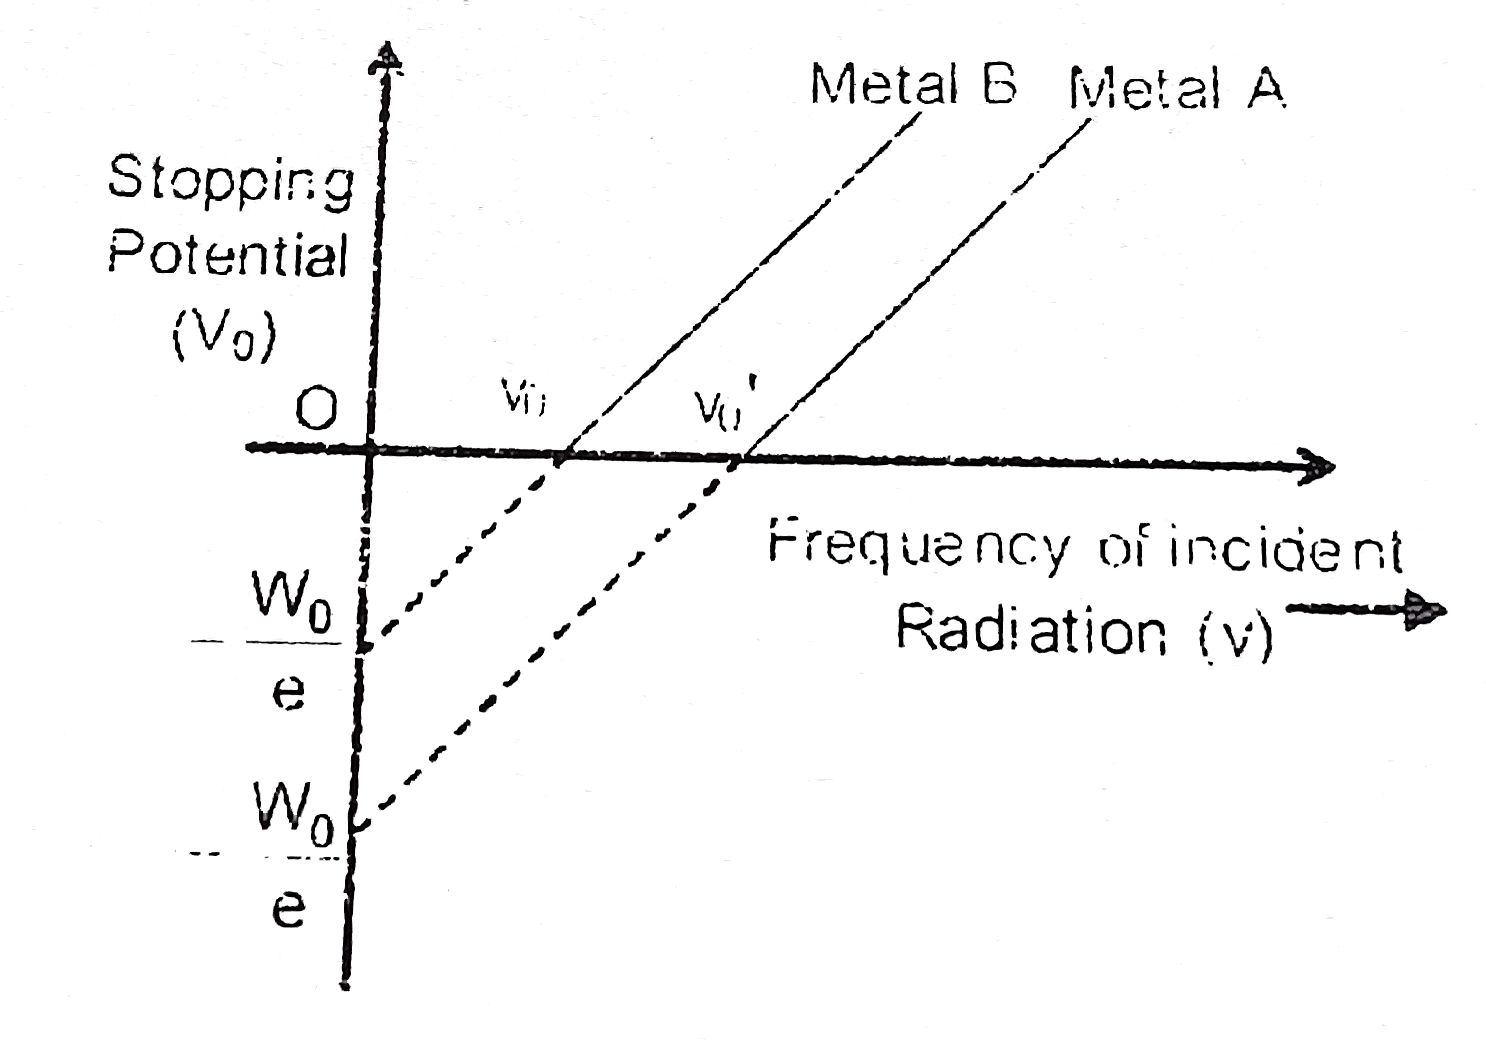
The graph shows variation of stopping potential V0 versus frequency of incident radiation v for two photosensitive metals A and B. Which of two metals has higher threshold frequency and why?
 View Solution
Sketch the graphs, showing the variation of stopping potential Vs with frequency v of the incident radiations for two photosensitive materials A and B having threshold frequencies v0>v'0 respectively.
(i) which of the two metals A or B has higher work function?
(ii) What information do you get from the slope of the graphs?
(iii) What does the value of the intercept of graph A on the potential axis represent?View SolutionFig. shows the variation of stopping potential V0 with the frequency v of the incident radiation for two photosensitive metal P and Q:
(i) Explain which metal has smaller threshold wavelength
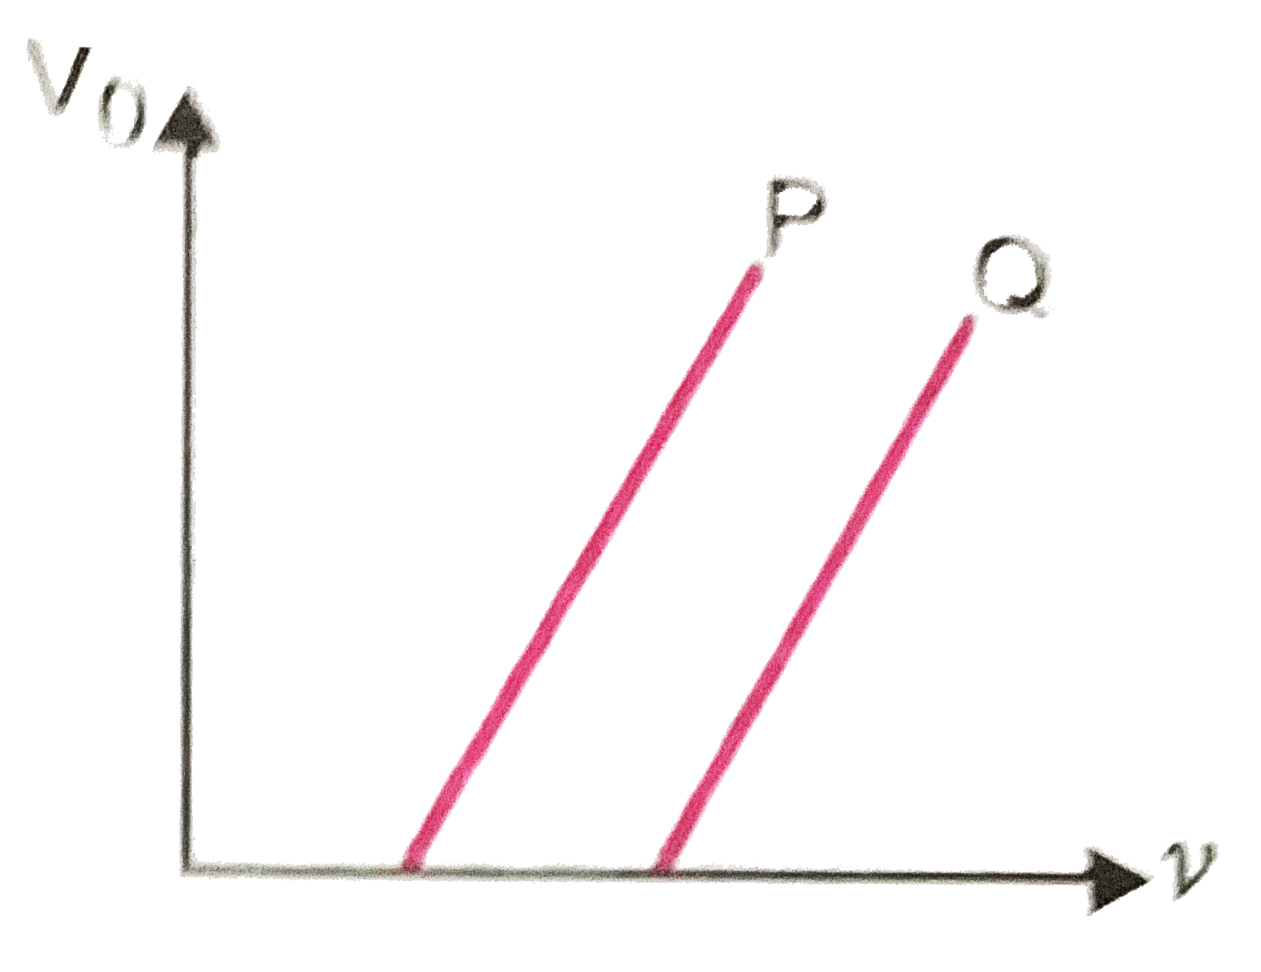
(ii) Explain, giving reason, which metal emits photoelectrons having smaller kinetic energy, for the same wavelength of incident radiation.
(iii) If the distance between the light source and metal P is doubled, how will the stopping potential change.View SolutionIn the study of a photoelectric effect the graph between the stopping potential V and frequency ν of the incident radiation on two different metals P and Q is shown in fig.
(i) which one of two metals have higher threshold frequency
(ii) Determine the work function of the metal which has greater value
(iii) Find the maximum kinetic energy of electron emitted by light of frequency 8×10¹⁴Hz for this metal.
 View Solution
The slope of the graph drawn between stopping potential and frequency of incident radiation will be
View Solution(i) Plot a labelled graph of |Vs| where Vs is stopping potential versus frequency f of the incident radiation.
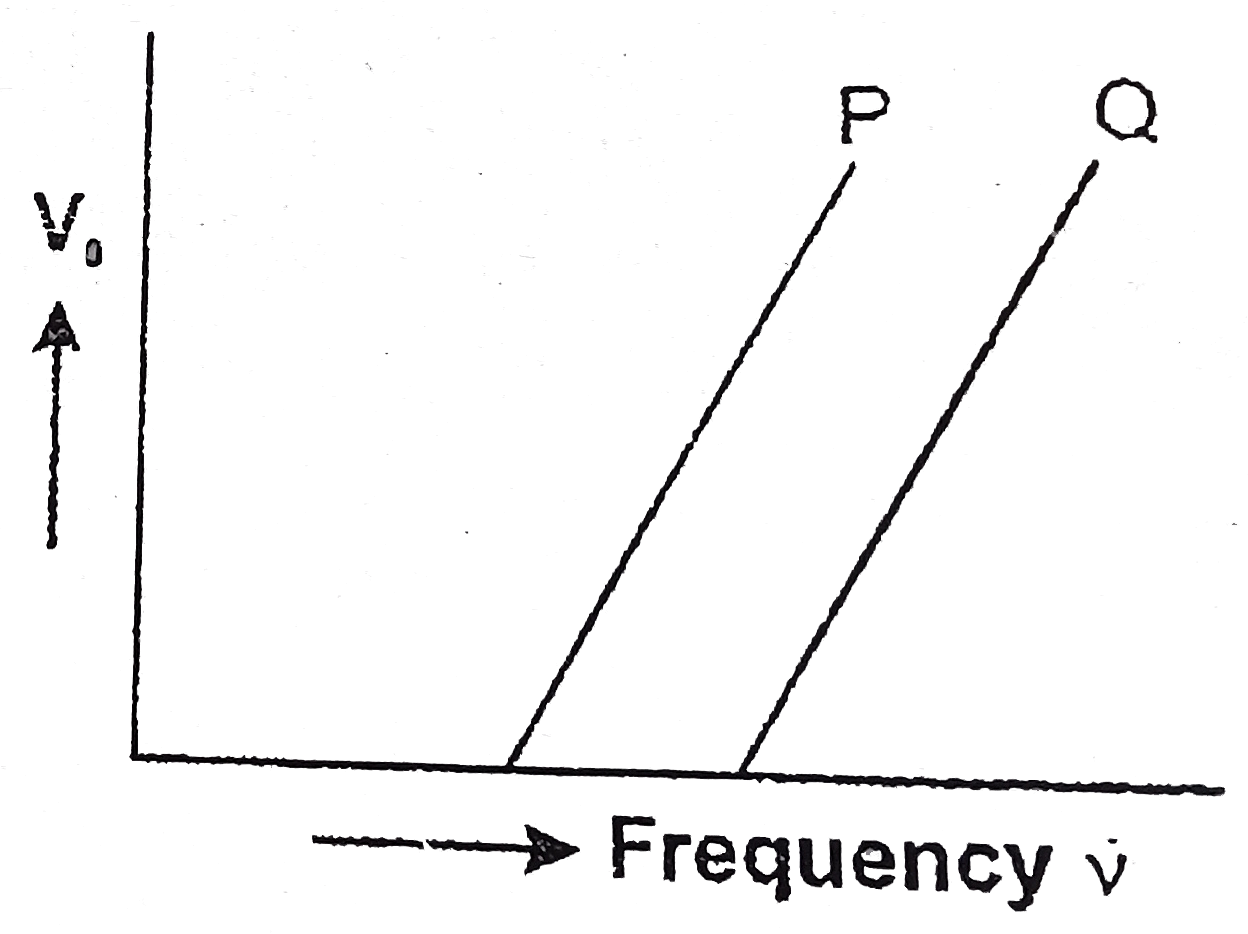
(ii) State how will you use this graph to determine the value of Planck.s constant.View SolutionThe graph between the stopping potential V0 and frequency v for two different metal plates P and Q are shown in the figure. Which of the metals has greater threshold wavelength and work function.
 View Solution
Plot a graph showing the variation of stopping potential with the frequency of incident radiation for two different photosensitive having work functions W1andW2(W1>W2) . On what factors does the (i) slope and (ii) intercept of the lines depend ?
View SolutionFigure shows the graph of stopping potential verus that frequency of a photosensitive metal. The plank's constant and work funcation of the metal are
_S01_035_Q01.png) View Solution
View SolutionExplain giving reasons for the following :
(a) Photoelectric current in a photocell increases with the increase in intensity of the incident radiation.
(b) The stopping potential V0 varies linearly with the frequency ν of the incident radiation for a given photosensitive surface with the slope remaining the same for different surfaces.
(c) Maximum kinetic energy of the photoelectrons is independent of the intensity of incident radiation.View Solution

